GraphRAG tables
Workflow
At a glance
The infomap.tl.graphrag adapter reads the entity and relationship Parquet
tables produced by a GraphRAG pipeline, runs Infomap on the resulting weighted
graph, and returns GraphRAG-style community tables ready to drop into a
retrieval pipeline.
Install the GraphRAG support with pip install "infomap[graphrag]".
Communities as retrieval units
GraphRAG pipelines turn a document corpus into a knowledge graph: an entities table of named concepts and a relationships table of weighted co-occurrences. The communities detected over this graph become the unit of retrieval: an LLM summarises each community, and those summaries are indexed for question-answering.
The default community detector in most GraphRAG implementations is Leiden, run
with a modularity objective; Infomap optimises the map equation instead (see
Reading Infomap through Louvain and Leiden). Whether that flow view groups your entities
more usefully than modularity depends on the graph; running both and comparing is
reasonable. The infomap.tl.graphrag adapter maps
the columns, translates node ids, extracts the hierarchy, and writes Parquet, so
an Infomap partition drops into GraphRAG’s table schema and the downstream
summarisation and retrieval steps run unchanged.
What Infomap optimises here
Two things about the objective are specific to GraphRAG input. Infomap uses the relationship weights directly as flow volumes, so a heavy co-occurrence link between two entities makes them harder to separate. And the typical GraphRAG graph is undirected and symmetric, so no directed-flow or teleportation assumptions are needed; Infomap runs in undirected mode by default.
From entity tables to communities
Build a synthetic GraphRAG dataset
The infomap.tl.graphrag adapter expects two Parquet tables (or two DataFrames)
with specific column names:
Table |
Required columns |
Notes |
|---|---|---|
|
|
|
|
|
|
The minimal example below is two tight triangles (Alpha–Beta–Gamma and Delta–Epsilon–Zeta) linked by one weak bridge edge. The two communities are obvious by design, so the result is easy to verify at a glance.
import pandas as pd

entities = pd.DataFrame({
    "id":    ["a",     "b",    "c",     "d",     "e",       "f"],
    "title": ["Alpha", "Beta", "Gamma", "Delta", "Epsilon", "Zeta"],
})

relationships = pd.DataFrame({
    "id":     ["ab",   "bc",    "ca",    "de",    "ef",      "fd",    "cd"],
    "source": ["Alpha","Beta",  "Gamma", "Delta", "Epsilon", "Zeta",  "Gamma"],
    "target": ["Beta", "Gamma", "Alpha", "Epsilon","Zeta",   "Delta", "Delta"],
    "weight": [2.0,    2.0,     2.0,     3.0,     3.0,      3.0,     1.0],
})

print(entities.to_string(index=False))
print()
print(relationships.to_string(index=False))
id   title
 a   Alpha
 b    Beta
 c   Gamma
 d   Delta
 e Epsilon
 f    Zeta

id  source  target  weight
ab   Alpha    Beta     2.0
bc    Beta   Gamma     2.0
ca   Gamma   Alpha     2.0
de   Delta Epsilon     3.0
ef Epsilon    Zeta     3.0
fd    Zeta   Delta     3.0
cd   Gamma   Delta     1.0
Write the tables to a temporary directory so run_graphrag_communities can read
them from disk, which mirrors real pipeline usage.
import tempfile
from pathlib import Path

work_dir = Path(tempfile.mkdtemp(prefix="infomap-graphrag-"))
input_dir = work_dir / "input"
input_dir.mkdir()

entities.to_parquet(input_dir / "entities.parquet")
relationships.to_parquet(input_dir / "relationships.parquet")
Inspect the node-id mapping
read_graphrag translates entity titles to the integer node ids that Infomap
expects. You can call it directly to preview the mapping before running the full
pipeline, which helps when debugging column-name mismatches.
from infomap.tl.graphrag import read_graphrag

graph = read_graphrag(entities, relationships)

relationships.assign(
    source_node=graph.sources,
    target_node=graph.targets,
)[["source", "target", "source_node", "target_node", "weight"]]
| source | target | source_node | target_node | weight | |
|---|---|---|---|---|---|
| 0 | Alpha | Beta | 1 | 2 | 2.0 |
| 1 | Beta | Gamma | 2 | 3 | 2.0 |
| 2 | Gamma | Alpha | 3 | 1 | 2.0 |
| 3 | Delta | Epsilon | 4 | 5 | 3.0 |
| 4 | Epsilon | Zeta | 5 | 6 | 3.0 |
| 5 | Zeta | Delta | 6 | 4 | 3.0 |
| 6 | Gamma | Delta | 3 | 4 | 1.0 |
Run Infomap
run_graphrag_communities reads the Parquet files from input_dir, builds the
weighted graph, runs Infomap, and returns a GraphRAGRunResult with two tables:
nodes (one row per entity) and communities (one row per detected community at
each hierarchy level).
from infomap.tl.graphrag import run_graphrag_communities

run_result = run_graphrag_communities(
    input_dir=input_dir,
    seed=123,
    num_trials=5,
)

partition = run_result.result  # the immutable Result from the run
print(f"Map equation codelength: {partition.codelength:.4f} bits/step")
print(f"Top-level communities:   {partition.num_top_modules}")
Map equation codelength: 1.9832 bits/step
Top-level communities:   2
Per-entity community assignments
The nodes table maps every entity to its module. The module_path column
encodes the full position in the hierarchy (a list of module ids from the root
to the leaf), and flow is the stationary probability of the random walk
visiting that entity, a natural measure of entity centrality within its
community.
run_result.nodes[["entity_title", "module_id", "module_path", "level", "flow"]]
| entity_title | module_id | module_path | level | flow | |
|---|---|---|---|---|---|
| 0 | Alpha | 1 | [1] | 1 | 0.12500 |
| 1 | Beta | 1 | [1] | 1 | 0.12500 |
| 2 | Gamma | 1 | [1] | 1 | 0.15625 |
| 3 | Delta | 2 | [2] | 1 | 0.21875 |
| 4 | Epsilon | 2 | [2] | 1 | 0.18750 |
| 5 | Zeta | 2 | [2] | 1 | 0.18750 |
GraphRAG-style community table
The communities table matches GraphRAG’s expected schema. Each row is one
community: a unique id, the level in the hierarchy (0 = top), size, the
list of entity_ids the community contains, and the list of relationship_ids
whose both endpoints fall within the community.
run_result.communities[[
    "id", "level", "title", "size",
    "entity_ids", "relationship_ids", "parent", "children",
]]
| id | level | title | size | entity_ids | relationship_ids | parent | children | |
|---|---|---|---|---|---|---|---|---|
| 0 | infomap-1 | 0 | Infomap community 1 | 3 | [a, b, c] | [ab, bc, ca] | -1 | [] |
| 1 | infomap-2 | 0 | Infomap community 2 | 3 | [d, e, f] | [de, ef, fd] | -1 | [] |
Infomap separates the two triangles into their own communities, {Alpha, Beta, Gamma} and {Delta, Epsilon, Zeta}. The weak bridge edge between Gamma and Delta carries too little flow to merge the groups.
Visualise the partition
Build a NetworkX graph from the relationship table and pass it to
draw_partition with the module assignments keyed by entity title.
import matplotlib.pyplot as plt
from myst_nb import glue

import networkx as nx
from docs_viz import draw_partition

g = nx.Graph()
for _, row in relationships.iterrows():
    g.add_edge(row["source"], row["target"], weight=row["weight"])

title_to_module = dict(
    zip(run_result.nodes["entity_title"], run_result.nodes["module_id"])
)
title_to_flow = dict(
    zip(run_result.nodes["entity_title"], run_result.nodes["flow"])
)

fig = draw_partition(g, title_to_module, flow=title_to_flow)
glue("fig-graphrag", fig, display=False)
plt.close(fig)
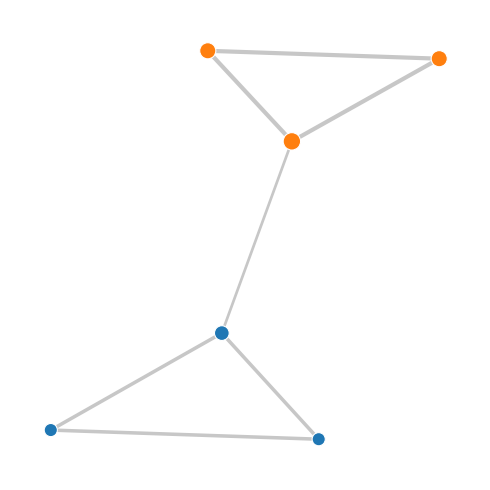
Fig. 14 The GraphRAG entity graph coloured by community. Infomap separates the two tightly linked entity groups; the thin bridge between them carries too little flow to merge them.
Write output to disk
If you need the Parquet tables on disk (for downstream summarisation or
ingestion into a vector store), pass output_dir to run_graphrag_communities.
The function writes infomap_nodes.parquet, communities.parquet, and an
infomap_run.json summary to the output directory.
output_dir = work_dir / "output"

result_with_output = run_graphrag_communities(
    input_dir=input_dir,
    output_dir=output_dir,
    seed=123,
    num_trials=5,
)

list(output_dir.iterdir())
[PosixPath('/tmp/infomap-graphrag-o24jo_vk/output/infomap_nodes.parquet'),
 PosixPath('/tmp/infomap-graphrag-o24jo_vk/output/communities.parquet'),
 PosixPath('/tmp/infomap-graphrag-o24jo_vk/output/infomap_run.json')]
You can also write the tables separately using write_graphrag_communities if
you have already run Infomap and just want to export:
from infomap.tl.graphrag import write_graphrag_communities

nodes, communities = write_graphrag_communities(
    result_with_output.result,
    graph=result_with_output.graph,
    output=output_dir / "communities_alt.parquet",
)
communities[["id", "level", "size", "entity_ids"]]
| id | level | size | entity_ids | |
|---|---|---|---|---|
| 0 | infomap-1 | 0 | 3 | [a, b, c] |
| 1 | infomap-2 | 0 | 3 | [d, e, f] |
Pitfalls
The tables need specific columns. Entities need
idandtitle; relationships needsource,target,weight(matching entitytitleby default). Point the adapter elsewhere withentity_title_col/endpoint_col/weight_col.Community ids are labels, not an order.
infomap-1and the like identify groups; the numbering is arbitrary across runs.Omit
output_dirto stay in memory. Pass it only when you want the Parquet tables written to disk.
API pointers
The infomap.tl.graphrag helpers:
read_graphrag() builds a
GraphRAGGraph from entity/relationship tables or
Parquet paths; run_graphrag_communities() is the
one-call pipeline, returning a GraphRAGRunResult
(read run metrics off its .result — the immutable Result,
e.g. run_result.result.codelength — not the deprecated accessors on
.infomap); and write_graphrag_communities() writes a
finished result back to GraphRAG-compatible Parquet. The Result metrics are
covered in Reading the result.
Going deeper
Companion notebook:
examples/notebooks/run-infomap-on-graphrag-tables.ipynbextends this example with a Leiden comparison and a retrieval-pipeline walkthrough.Building a network covers all the ways to feed data into Infomap.
The map equation is the objective
run_graphrag_communitiesminimises.Edge et al. [2024] introduced the GraphRAG pipeline and its community-hierarchy approach.