Infomap quickstart
Go from a Python graph to an Infomap result, then inspect, summarize, visualize, and reuse it.
import matplotlib.pyplot as plt
import networkx as nx
import pandas as pd

from infomap import Infomap
Run Infomap on a familiar graph
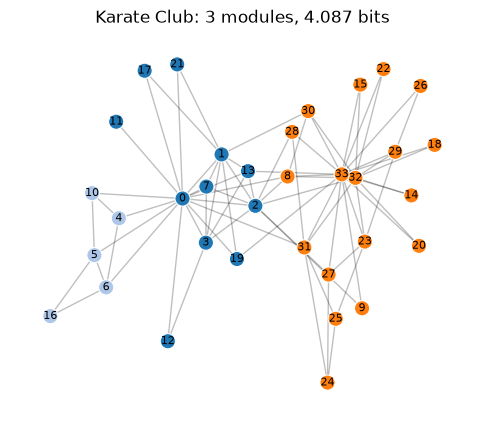
Start with Zachary’s Karate Club graph. It is small enough to inspect and familiar enough to make the partition easy to judge.
graph = nx.karate_club_graph()

im = Infomap(silent=True, num_trials=20, seed=123)
node_mapping = im.add_networkx_graph(graph)
im.run()
im
The Infomap object summarizes the result in place. Codelength and relative savings describe compression. Module counts describe the partition. The flow strip shows how much flow belongs to the largest top modules.
assignments = {
    node_mapping[node.state_id]: node.module_id
    for node in im.nodes
    if node.state_id in node_mapping
}

result = im.to_dataframe(
    columns=["node_id", "module_id", "flow", "path"],
    index="node_id",
).rename(index=node_mapping)
result.head()
| module_id | flow | path | |
|---|---|---|---|
| node_id | |||
| 0 | 1 | 0.090909 | (1, 1) |
| 1 | 1 | 0.062771 | (1, 2) |
| 2 | 1 | 0.071429 | (1, 3) |
| 3 | 1 | 0.038961 | (1, 4) |
| 7 | 1 | 0.028139 | (1, 5) |
Draw a readable partition
This helper is notebook-local. It is meant to be copied, changed, or deleted. It is not a public Infomap plotting API.
def draw_network_partition(graph, modules, *, title=None, seed=7, ax=None):
    if ax is None:
        _, ax = plt.subplots(figsize=(6, 5))

    pos = nx.spring_layout(graph, seed=seed)
    module_ids = sorted(set(modules.values()))
    palette = plt.get_cmap("tab20")
    colors = {
        module_id: palette(index % 20) for index, module_id in enumerate(module_ids)
    }
    node_colors = [colors[modules[node]] for node in graph.nodes]

    nx.draw_networkx_edges(graph, pos, ax=ax, alpha=0.25, width=1.0)
    nx.draw_networkx_nodes(
        graph,
        pos,
        ax=ax,
        node_color=node_colors,
        node_size=120,
        linewidths=0.8,
        edgecolors="white",
    )
    nx.draw_networkx_labels(graph, pos, ax=ax, font_size=8)
    ax.set_title(title or "Infomap partition")
    ax.axis("off")
    return ax


draw_network_partition(
    graph,
    assignments,
    title=f"Karate Club: {im.num_top_modules} modules, {im.codelength:.3f} bits",
);
Move from toy graph to research data
For larger networks, the first view should usually be a result summary and a table, not a force-directed drawing.
jazz = Infomap(silent=True, num_trials=20, seed=123)
jazz.read_file("data/jazz.net")
jazz.run()
jazz
jazz_nodes = jazz.to_dataframe(columns=["node_id", "module_id", "flow"])

module_summary = (
    jazz_nodes.groupby("module_id", as_index=False)
    .agg(nodes=("node_id", "count"), flow=("flow", "sum"))
    .sort_values("flow", ascending=False)
    .reset_index(drop=True)
)
module_summary.head(10)
| module_id | nodes | flow | |
|---|---|---|---|
| 0 | 2 | 70 | 0.419949 |
| 1 | 1 | 63 | 0.352845 |
| 2 | 3 | 57 | 0.217907 |
| 3 | 6 | 3 | 0.006747 |
| 4 | 4 | 3 | 0.001641 |
| 5 | 5 | 2 | 0.000912 |
Use the quick function when you only need assignments
The Infomap object gives you the richest result. For scripts that only need a node-to-module mapping, use the NetworkX helper.
from infomap import find_communities

communities = find_communities(graph, seed=123, num_trials=20)
pd.Series(communities, name="module_id").head()
0              {0, 1, 2, 3, 7, 11, 12, 13, 17, 19, 21}
1                                    {4, 5, 6, 10, 16}
2    {32, 33, 8, 9, 14, 15, 18, 20, 22, 23, 24, 25,...
Name: module_id, dtype: object
Export results
Use dataframes for analysis, annotated graph objects for Python workflows, and GraphML or GEXF when you want to continue in visualization tools.
annotated_graph = graph.copy()
nx.set_node_attributes(annotated_graph, assignments, "infomap_module")

result.to_csv("output/karate-infomap-nodes.csv")
nx.write_graphml(annotated_graph, "output/karate-infomap.graphml")
How to cite
If you use Infomap in published work, mapequation.org recommends citing two things: the map equation paper (Rosvall and Bergstrom, 2008, https://doi.org/10.1073/pnas.0706851105) for the method, and the MapEquation software package (Edler, Holmgren, and Rosvall) for the implementation and version. See How to cite for BibTeX.
Where to go next
options guide explains every Infomap option.
benchmark-performance helps you plan run time and memory.
The compare notebooks put Infomap next to Louvain and Leiden in NetworkX, igraph, and Scanpy workflows.