

Tutorial
Understand the mechanics of the Map Equation through interactive visualizations.
Apps
Explore module hierarchies, compare partitions, inspect higher-order state networks, visualize bioregions, and color modules consistently.
Understand the mechanics of the Map Equation through interactive visualizations.

Browse Infomap results and zoom through the module hierarchy.

Map species distributions to coherent bioregions and inspect them on a globe.
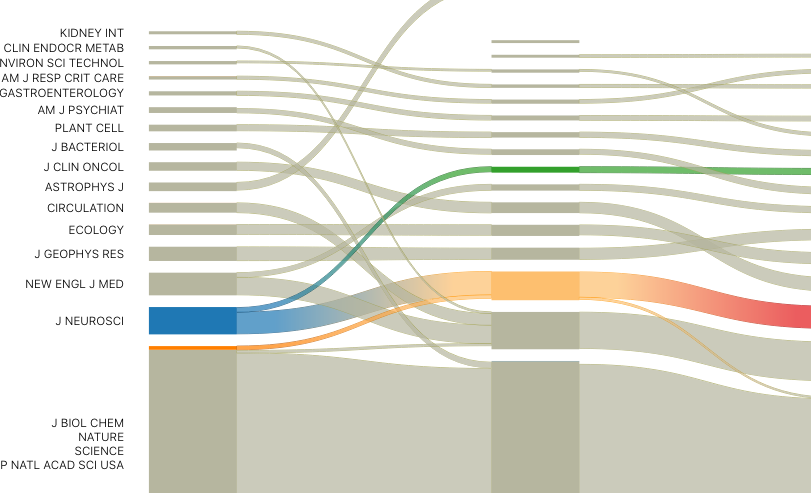
Compare partitions side by side to see which modules split, merge, or persist.

Inspect the higher-order state networks behind memory and context effects.
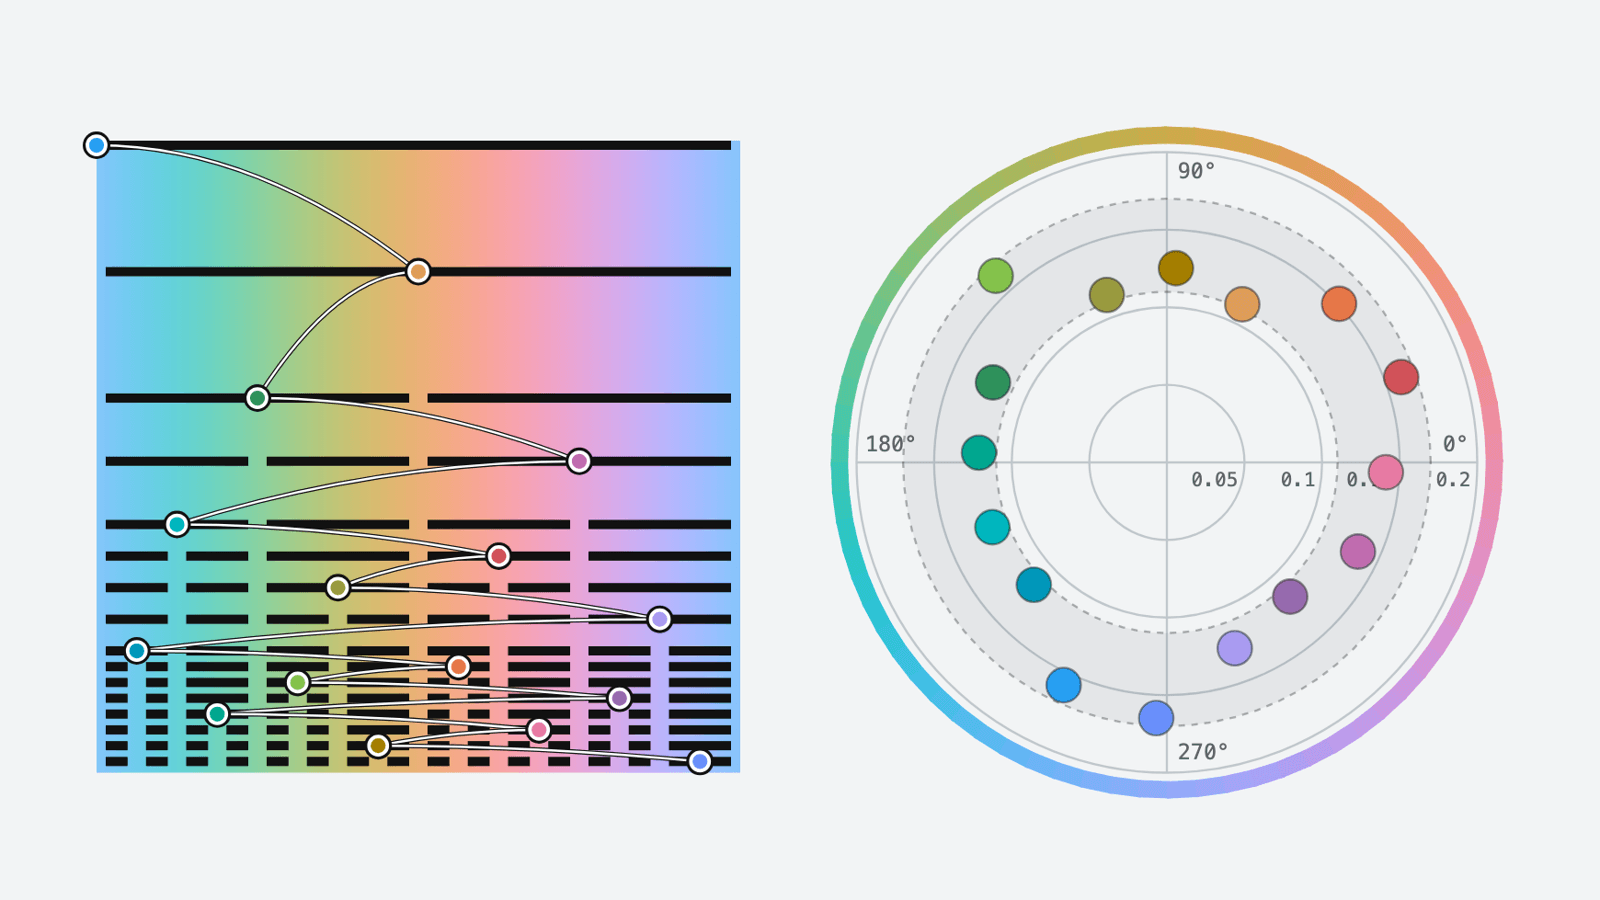
Generate distinct, deterministic categorical colors for maps and charts.
The packages behind the apps, for your own analyses, notebooks, and web apps.
Community detection with the map equation, in Python, R, and the browser through WebAssembly.
npm install @mapequation/infomapDraw the Alluvial Generator's diagrams of changing partitions in web apps, or with matplotlib in Python.
npm install @mapequation/alluvial-diagramGenerate distinct and consistent categorical colors in milliseconds for your interactive maps and plots.
npm install @mapequation/c3Tutorials, validation tools, and significance tests for researchers working with map equation results.
Walkthrough of the map equation, two-level and multilevel phases, memory and multilayer networks, and the solution landscape.
infomap/examples/notebooks ↗
Identify partition clusters and validate other partitions.
mapequation/partition-validation ↗
Assess the significance of cluster assignments via bootstrap.
mapequation/significance-clustering ↗