
Publications
Papers behind the Map Equation framework
Find the core method papers, software citations, surveys, and application papers for flow-based community detection with Infomap.
How to cite
Most papers using Infomap cite two things: the software package, which identifies the implementation and version, and the map equation paper, which credits the method.
2026 · v2.15.0
The MapEquation software package
Edler, D., Holmgren, A., & Rosvall, M. Cite this when your analysis depends on Infomap as software and the release version matters for reproducibility.
Featured
Featured papers
Community Detection with the Map Equation and Infomap: Theory and Applications
Jelena Smiljanić, Christopher Blöcker, Anton Holmgren, Daniel Edler, Magnus Neuman, Martin Rosvall
ACM Computing Surveys 58(7), 1-34 (2026)

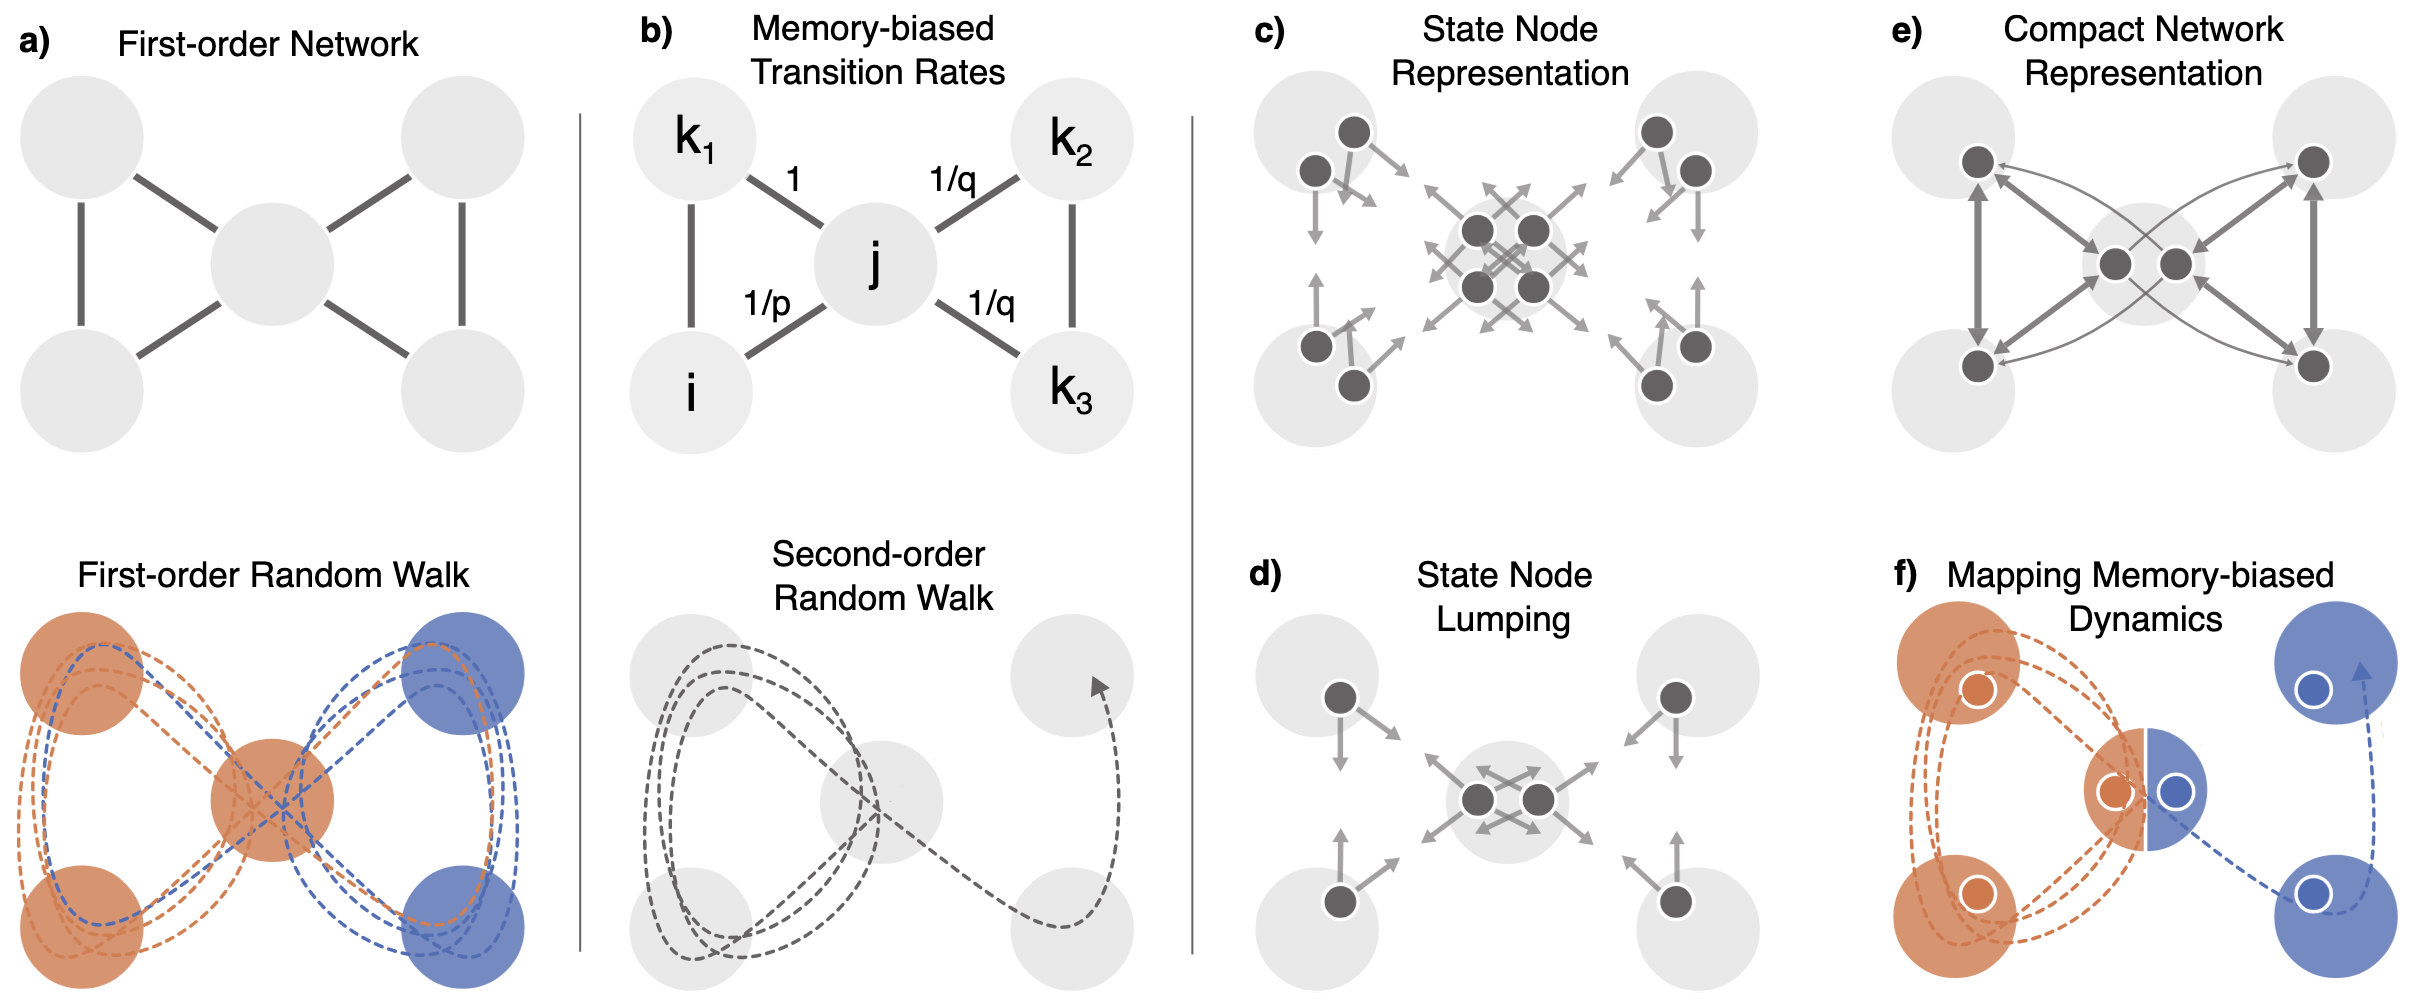
Mapping memory-biased dynamics with compact models reveals overlapping communities in large networks
Maja Lindström, Rohit Sahasrabuddhe, Anton Holmgren, Christopher Blöcker, Daniel Edler, Martin Rosvall
Journal of Physics: Complexity (2026)
Compressing regularized dynamics improves link prediction with the map equation in sparse networks
Maja Lindström, Christopher Blöcker, Tommy Löfstedt, Martin Rosvall
Physical Review E 111, 054314 (2025)
All papers
Real-world networks have a complex topology comprising many elements often structured into communities. Revealing these communities helps researchers uncover the organizational and functional structure of the system that the network represents. However, detecting community structures in complex networks requires selecting a community detection method among a multitude of alternatives with different network representations, community interpretations, and underlying mechanisms. This tutorial focuses on a popular community detection method called the map equation and its search algorithm Infomap. The map equation framework for community detection describes communities by analyzing dynamic processes on the network. Thanks to its flexibility, the map equation provides extensions that can incorporate various assumptions about network structure and dynamics. To help decide if the map equation is a suitable community detection method for a given complex system and problem at hand — and which variant to choose — we review the map equation's theoretical framework and guide users in applying the map equation to various research problems.
ACM Computing Surveys 58(7), 1-34 (2026)
DOI ↗arXiv:2311.04036 PDF Google ScholarTutorial notebooks ↗Many real-world systems, from social networks to protein-protein interactions and species distributions, exhibit overlapping flow-based communities that reflect their functional organisation. However, reliably identifying such overlapping flow-based communities requires higher-order relational data, which are often unavailable. To address this challenge, we capitalise on the flow model underpinning the representation-learning algorithm node2vec and model higher-order flows through memory-biased random walks on first-order networks. Instead of simulating these walks, we model their higher-order dynamic constraints with compact models and control model complexity with an information-theoretic approach. Using the map equation framework, we identify overlapping modules in the resulting higher-order networks. Our compact-model approach proves robust across synthetic benchmark networks, reveals interpretable overlapping communities in empirical networks, and scales to large networks.
Journal of Physics: Complexity (2026)
DOI ↗arXiv:2304.05775 PDF Google ScholarNotebooks ↗Sparse states implementation ↗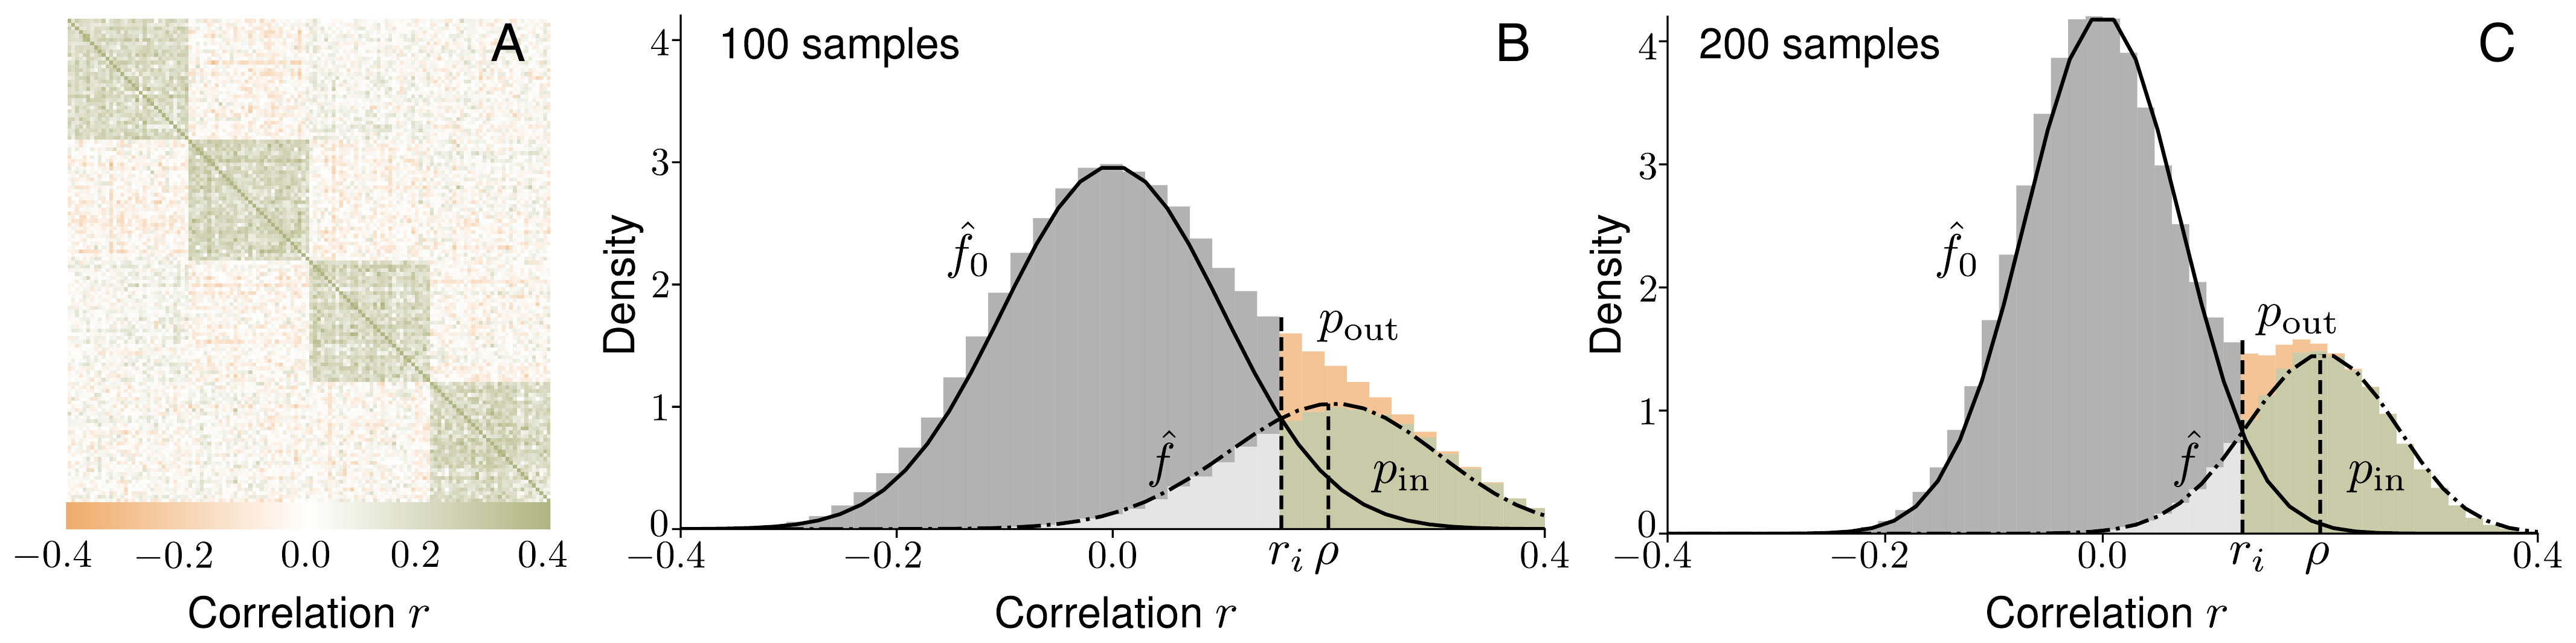
From neuroscience and genomics to systems biology and ecology, researchers rely on clustering similarity data to uncover modular structure. Yet widely used clustering methods, such as hierarchical clustering, k-means, and WGCNA, lack principled model selection, leaving them susceptible to noise. A common workaround sparsifies a correlation matrix representation to remove noise before clustering, but this extra step introduces arbitrary thresholds that can distort the structure and lead to unreliable results. To detect reliable clusters, we capitalize on recent advances in network science to unite sparsification and clustering with principled model selection. We test two Bayesian community detection methods, the Degree-Corrected Stochastic Block Model and the Regularized Map Equation, both grounded in the Minimum Description Length principle for model selection. In synthetic data, they outperform traditional approaches, detecting planted clusters under high-noise conditions and with fewer samples. Compared to WGCNA on gene co-expression data, the Regularized Map Equation identifies more robust and functionally coherent gene modules. Our results establish Bayesian community detection as a principled and noise-resistant framework for uncovering modular structure in high-dimensional data across fields.
Predicting future interactions or novel links in networks is an indispensable tool across diverse domains, including genetic research, online social networks, and recommendation systems. Among the numerous techniques developed for link prediction, those leveraging the networks' community structure have proven highly effective. For example, the recently proposed MapSim predicts links based on a similarity measure derived from the code structure of the map equation, a community-detection objective function that operates on network flows. However, the standard map equation assumes complete observations and typically identifies many small modules in networks where the nodes connect through only a few links. This aspect can degrade MapSim's performance on sparse networks. To overcome this limitation, we propose to incorporate a global regularization method based on a Bayesian estimate of the transition rates along with three local regularization methods. The regularized versions of the map equation compensate for incomplete observations and mitigate spurious community fragmentation in sparse networks. The regularized methods outperform standard MapSim and several state-of-the-art embedding methods in highly sparse networks. The principled global method requires no hyperparameter tuning and runs at least an order of magnitude faster than the embedding methods.
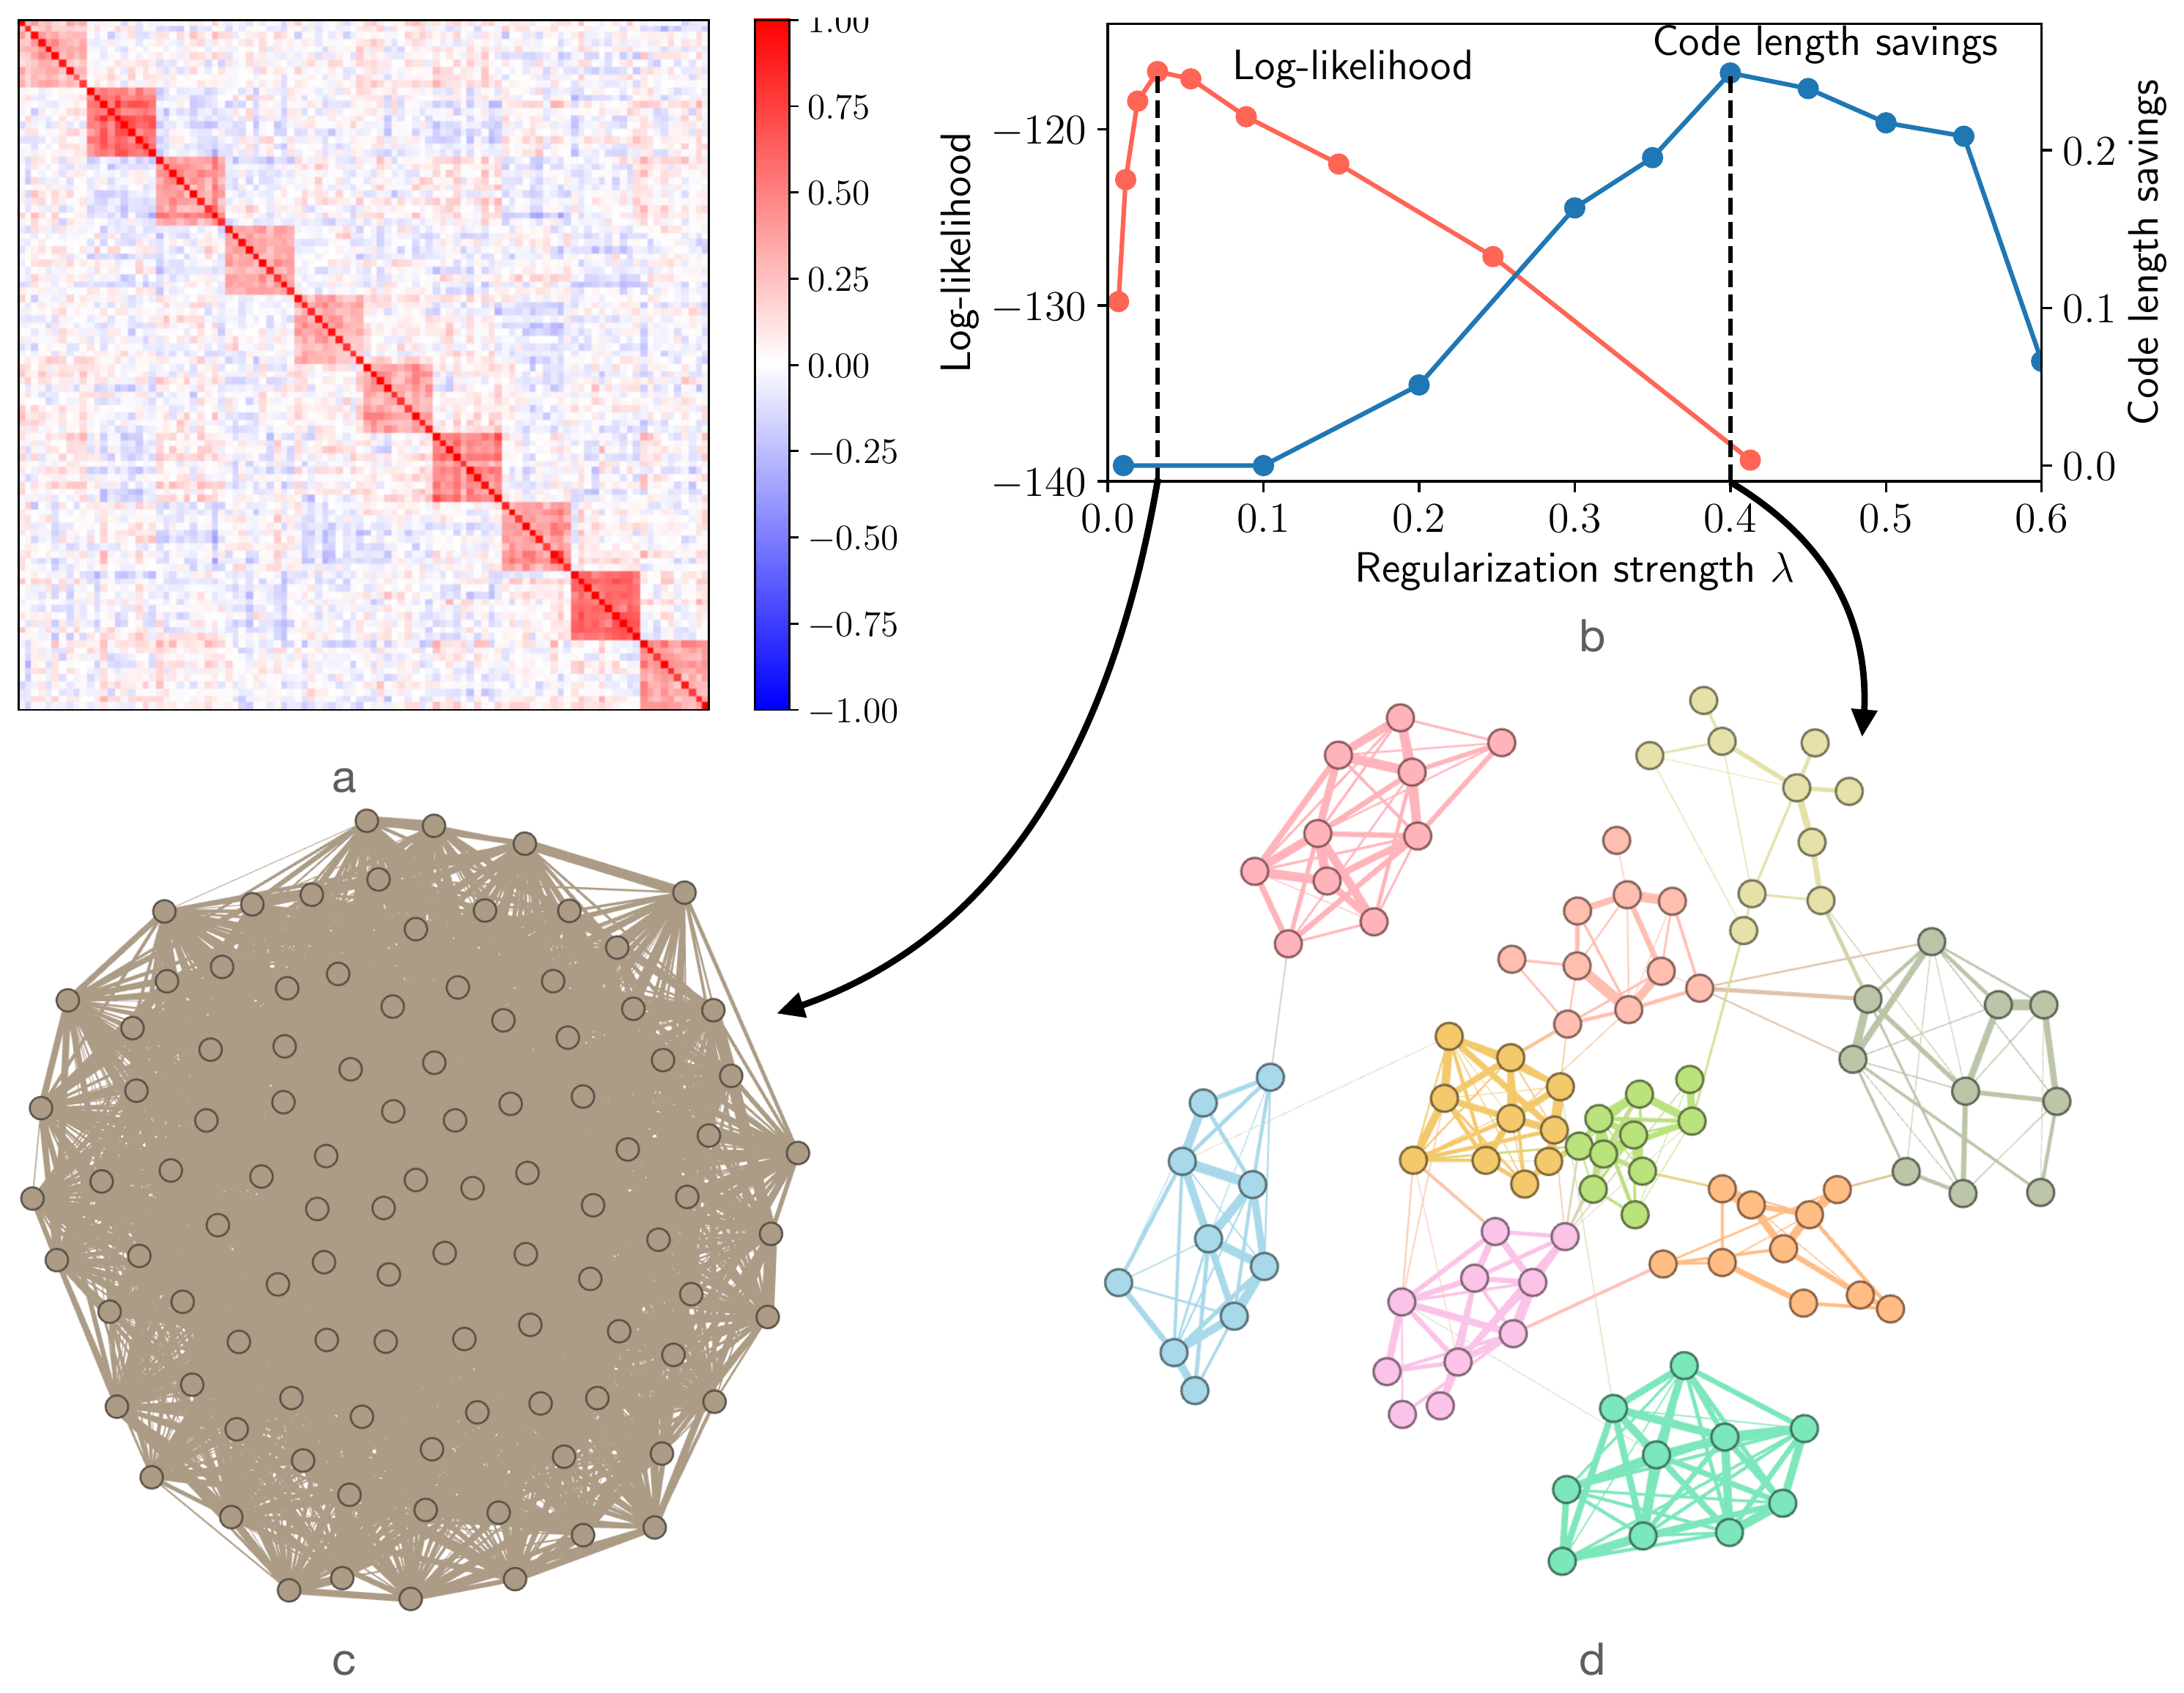
Inferring relations from correlational data allows researchers across the sciences to uncover complex connections between variables for insights into the underlying mechanisms. The researchers often represent inferred relations using Gaussian graphical models, requiring regularization to sparsify the models. Acknowledging that the modular structure of the inferred network is often studied, we suggest module-based regularization to balance under- and overfitting. Compared with the graphical lasso, a standard approach using the Gaussian log-likelihood for estimating the regularization strength, this approach better recovers and infers modular structure in noisy synthetic and real data. The module-based regularization technique improves the usefulness of Gaussian graphical models in the many applications where they are employed.
While temporal networks contain crucial information about the evolving systems they represent, only recently have researchers showed how to incorporate higher-order Markov chains, community structure and abrupt transitions to describe them. However, each approach can only capture one aspect of temporal networks, which often are multifaceted with dynamics taking place concurrently at small and large structural scales and also at short and long timescales. Therefore, these approaches must be combined for more realistic descriptions of empirical systems. Here we present two data-driven approaches developed to capture multiple aspects of temporal network dynamics. Both approaches capture short timescales and small structural scales with Markov chains. Whereas one approach also captures large structural scales with communities, the other instead captures long timescales with change points. Using a nonparametric Bayesian inference framework, we illustrate how the multi-aspect approaches better describe evolving systems by combining different scales, because the most plausible models combine short timescales and small structural scales with large-scale structural and dynamical modular patterns or many change points.
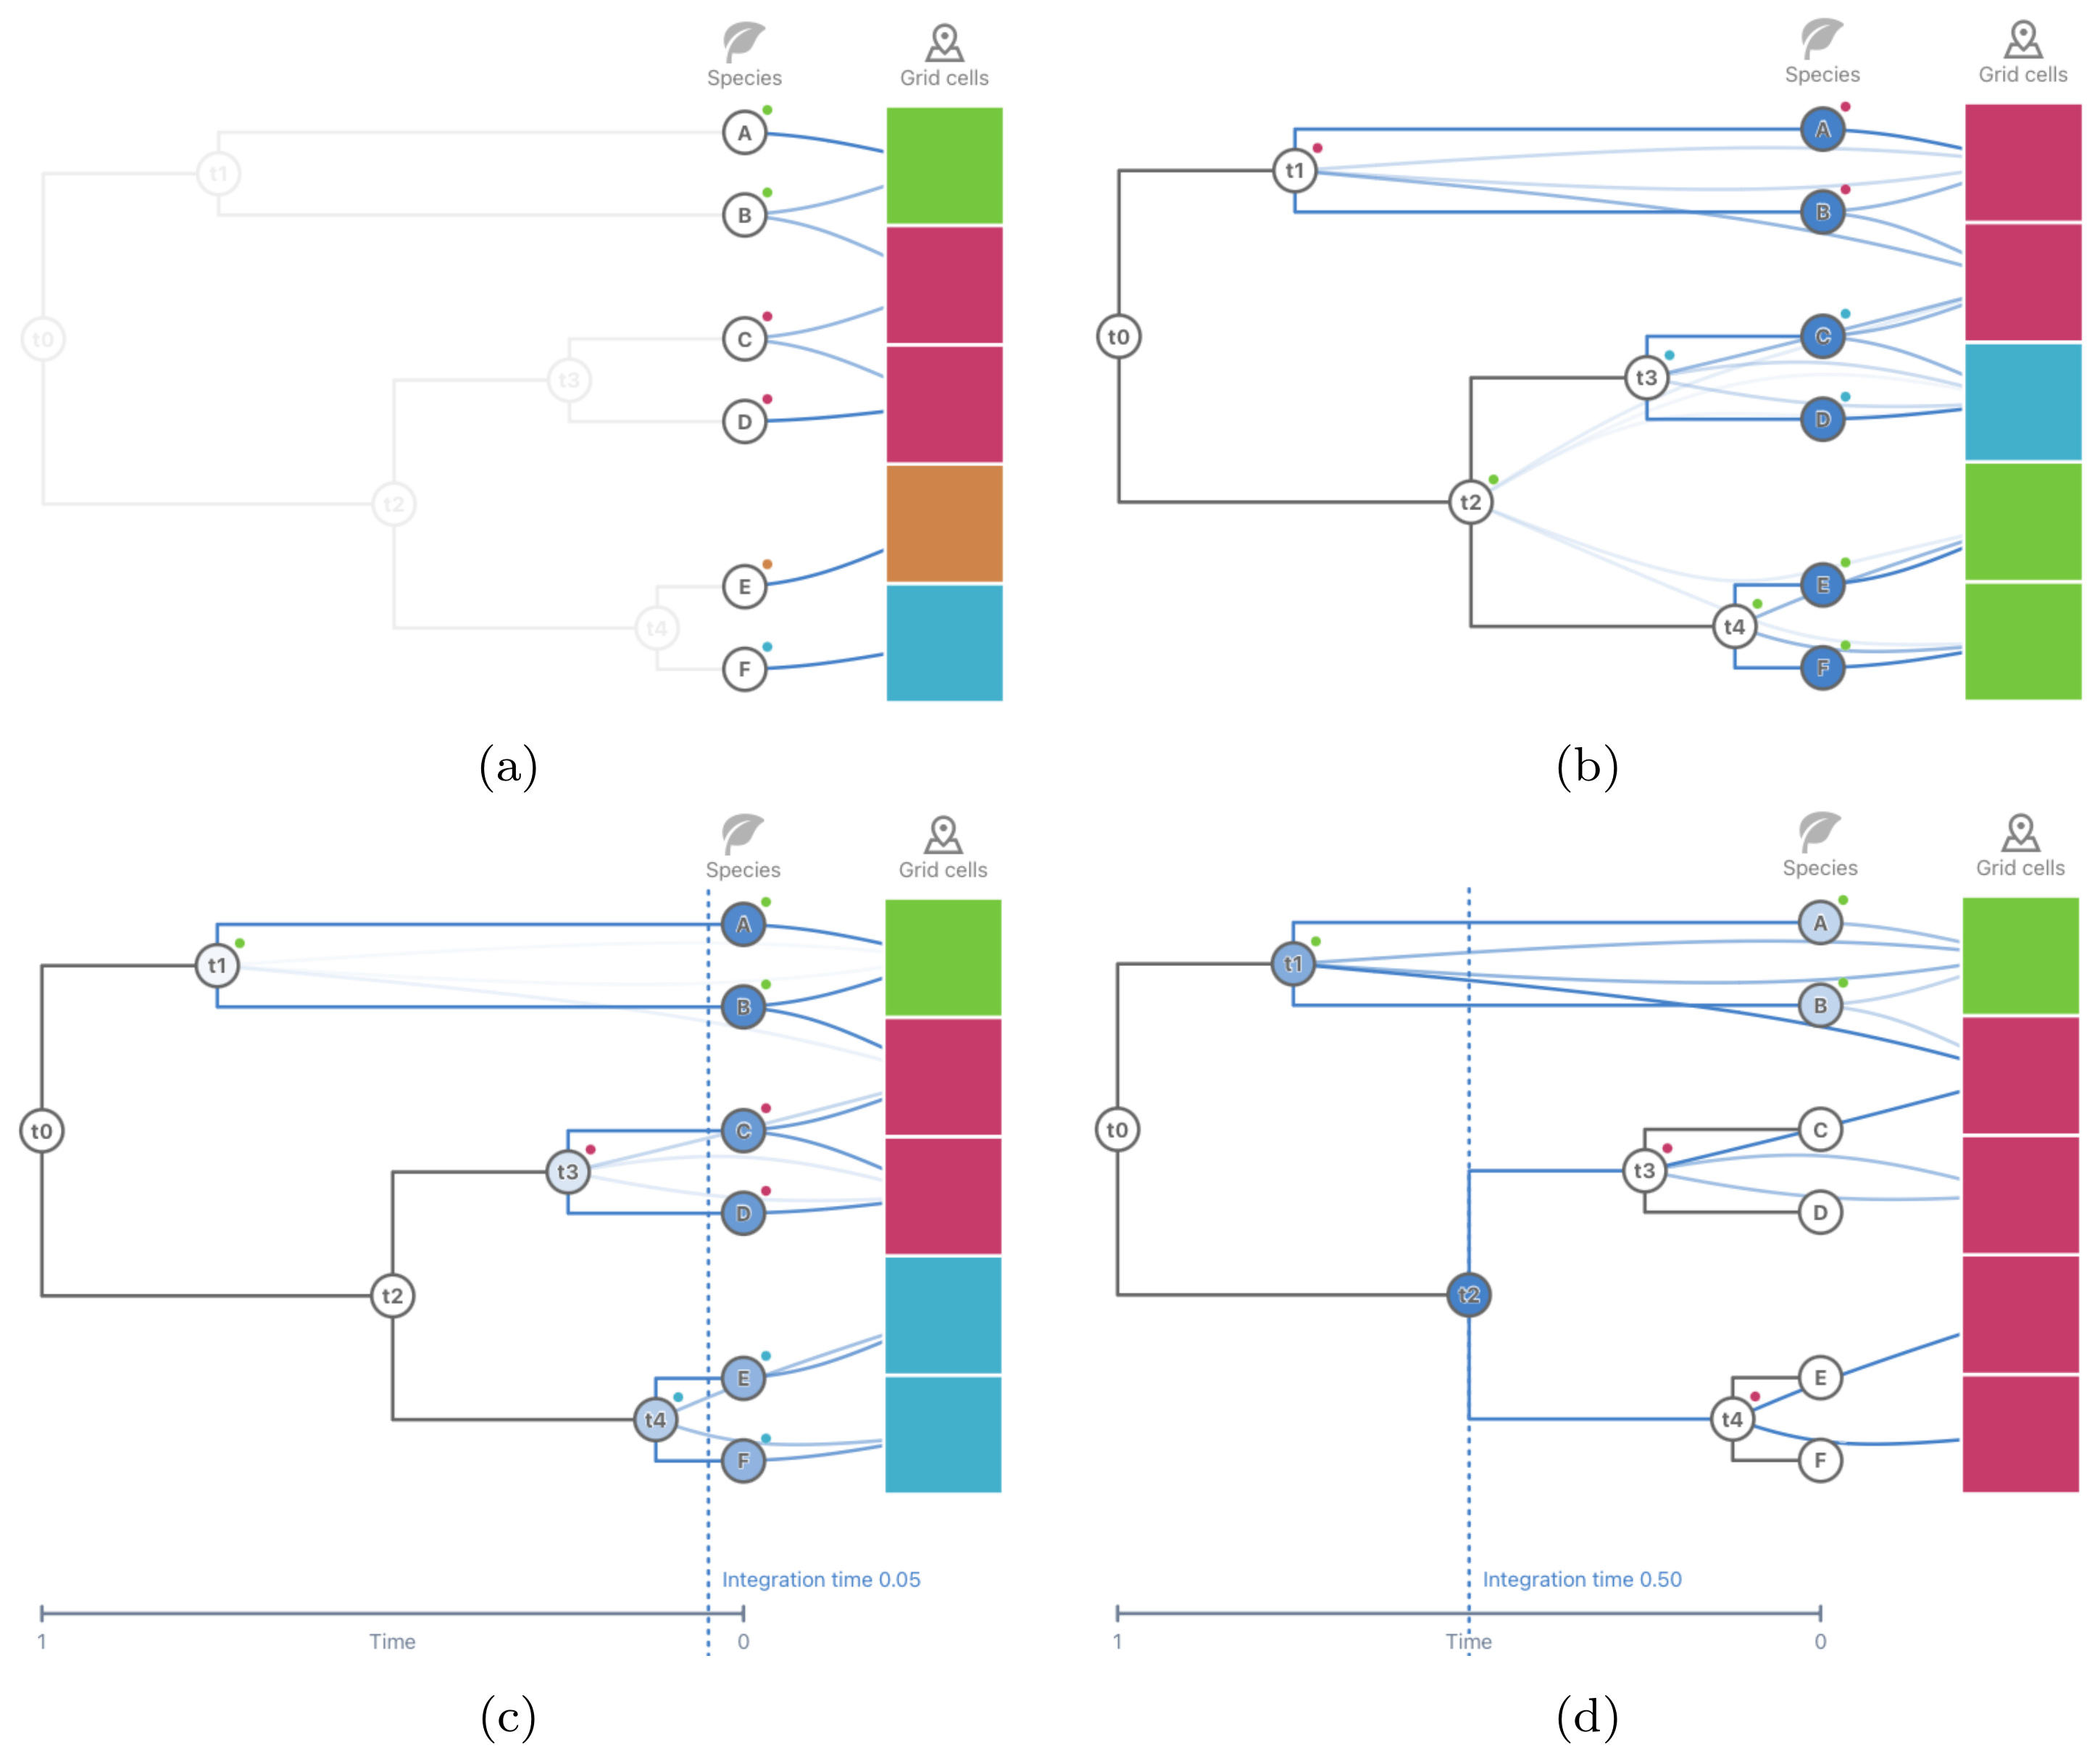
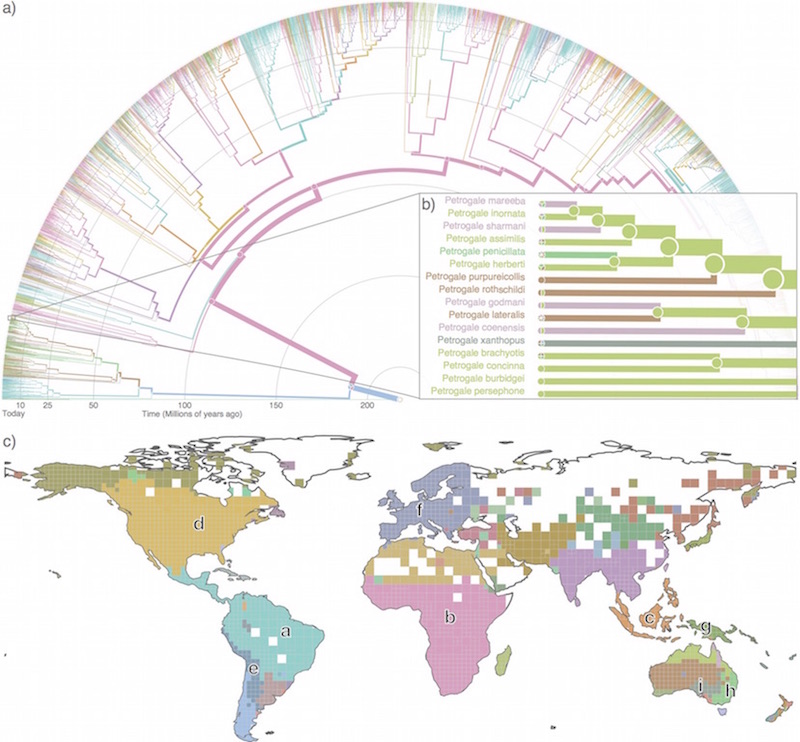
Identifying and understanding the large-scale biodiversity patterns in time and space is vital for conservation and addressing fundamental ecological and evolutionary questions. Network-based methods have proven useful for simplifying and highlighting important structures in species distribution data. However, current network-based biogeography approaches cannot exploit the evolutionary information available in phylogenetic data. We introduce a method for incorporating evolutionary relationships into species occurrence networks to produce more biologically informative and robust bioregions. To keep the bipartite network structure where bioregions are grid cells indirectly connected through shared species, we incorporate the phylogenetic tree by connecting ancestral nodes to the grid cells where their descendant species occur. To incorporate the whole tree without destroying the spatial signal of narrowly distributed species or ancestral nodes, we weigh tree nodes by the geographic information they provide. For a more detailed analysis, we enable integration of the evolutionary relationships at a specific time in the tree. By sweeping through the phylogenetic tree in time, our method interpolates between finding bioregions based only on distributional data and finding spatially segregated clades, uncovering evolutionarily distinct bioregions at different time slices. We also introduce a way to segregate the connections between evolutionary branches at a selected time to enable exploration of overlapping evolutionarily distinct regions. We have implemented these methods in Infomap Bioregions, an interactive web application that makes it easy to explore the possibly hierarchical and fuzzy patterns of biodiversity on different scales in time and space.
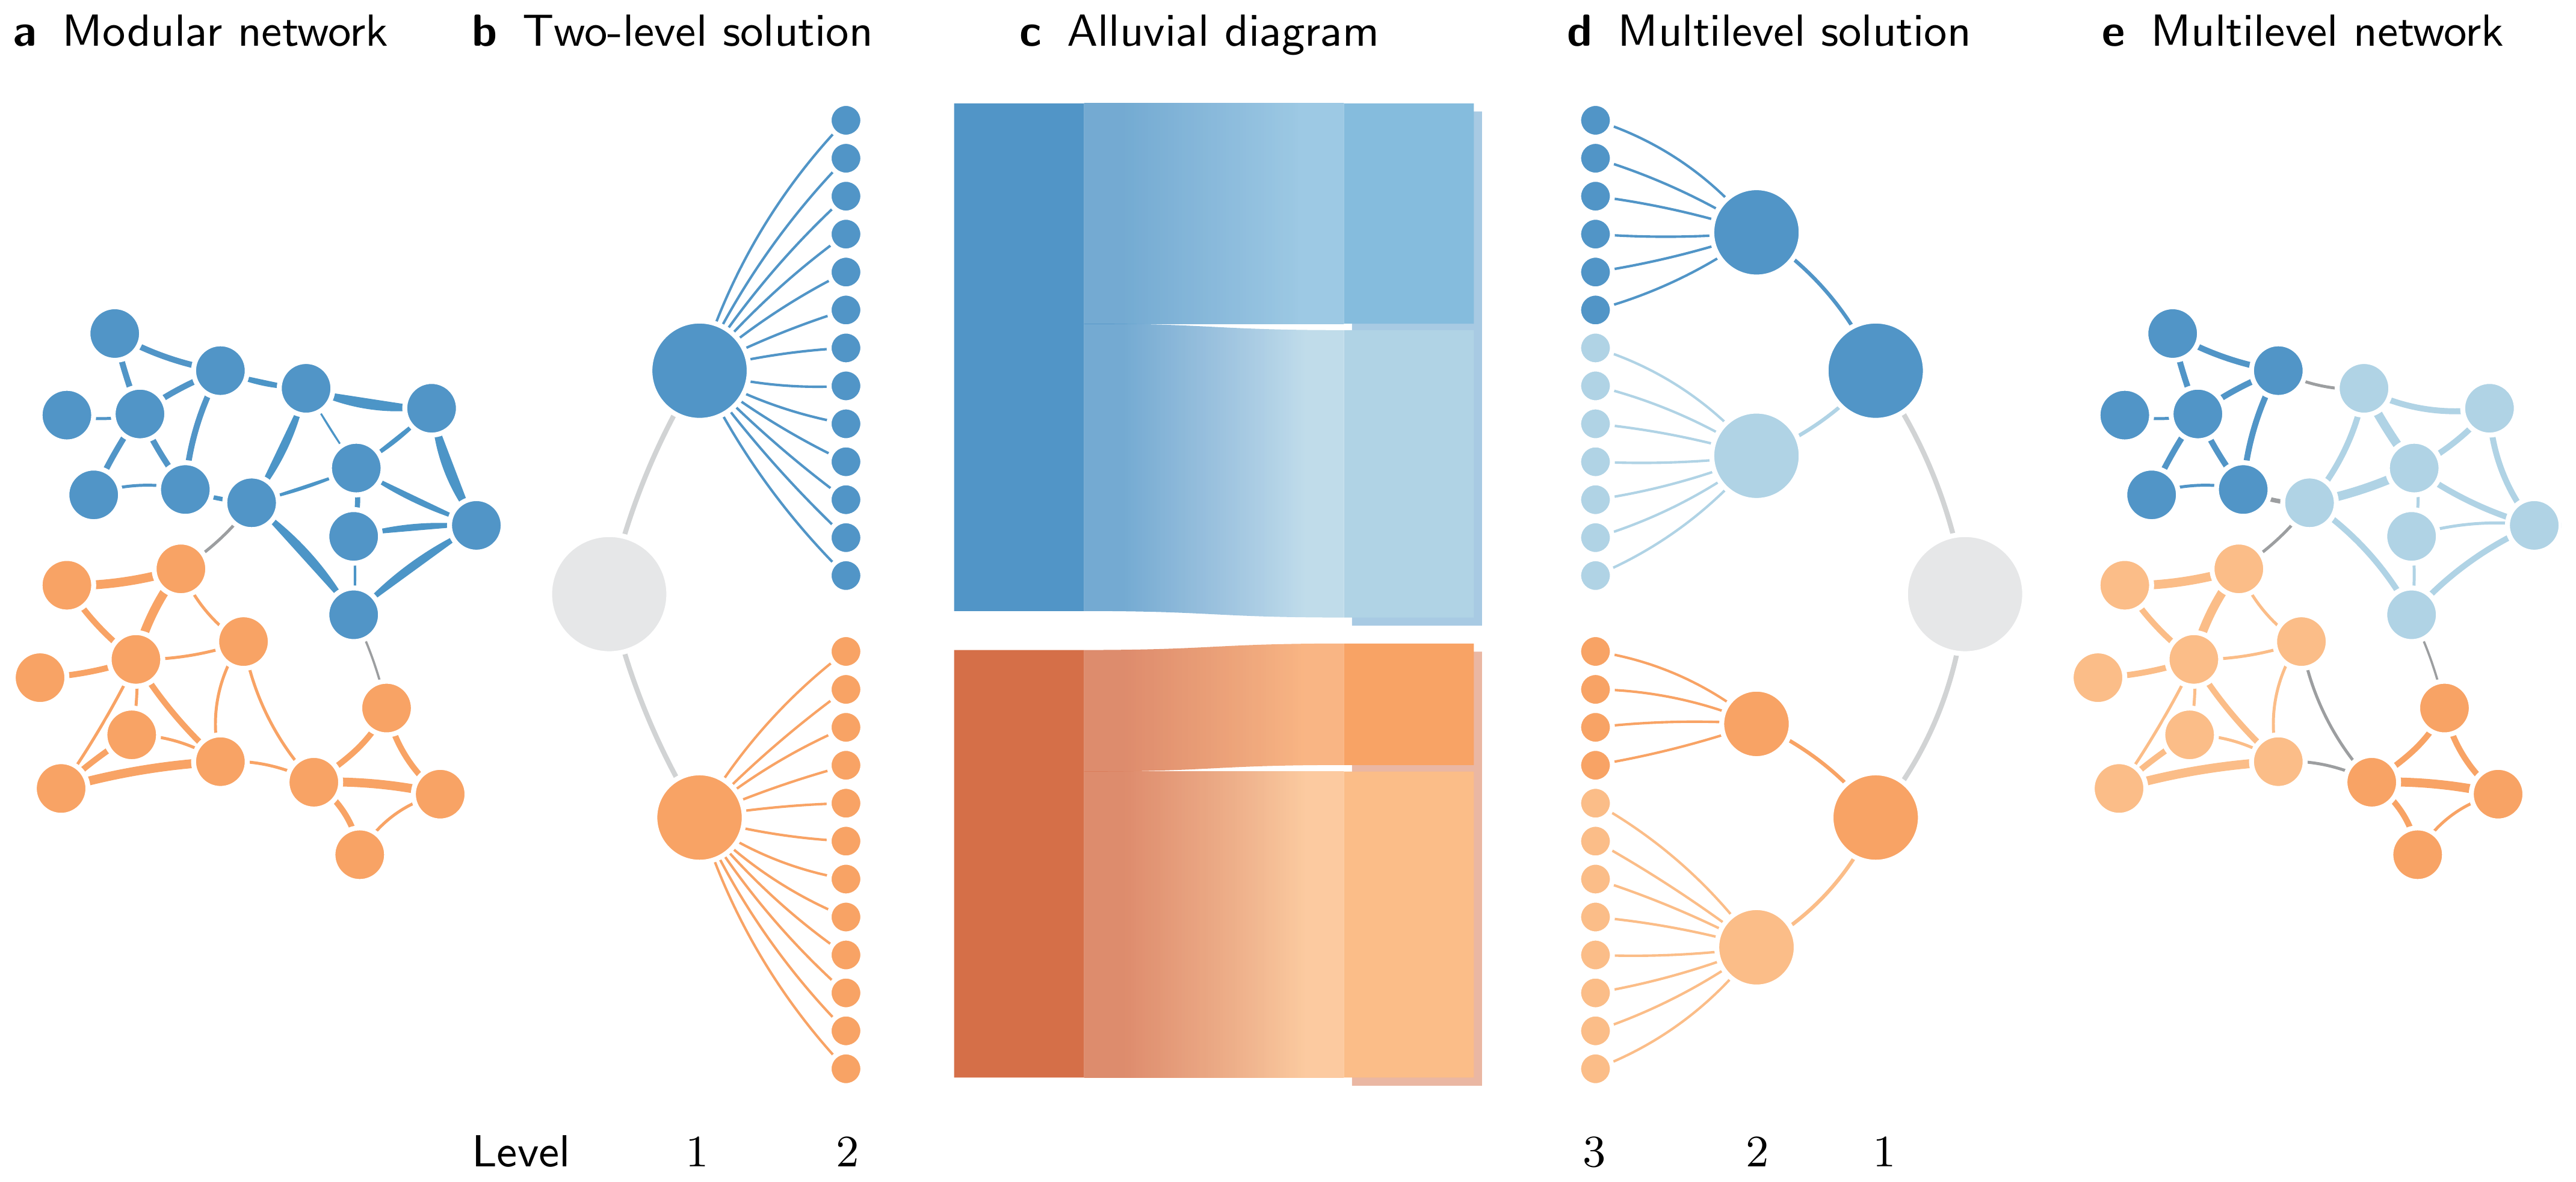
New network models of complex systems use layers, state nodes, or hyperedges to capture higher-order interactions and dynamics. Simplifying how the higher-order networks change over time or depending on the network model would be easy with alluvial diagrams, which visualize community splits and merges between networks. However, alluvial diagrams were developed for networks with regular nodes assigned to non-overlapping flat communities. How should they be defined for nodes in layers, state nodes, or hyperedges? How can they depict multilevel, overlapping communities? Here we generalize alluvial diagrams to map change in higher-order networks and provide an interactive tool for anyone to generate alluvial diagrams. We use the alluvial generator to illustrate the effect of modeling network flows with memory in a citation network, distinguishing multidisciplinary from field-specific journals.
Applied Network Science 8, 42 (2023)
DOI ↗arXiv:2303.00622 PDF Google ScholarAlluvial app ↗Notebooks ↗Multilevel significance clustering ↗Analyzing relational data consisting of multiple samples or layers involves critical challenges: How many networks are required to capture the variety of structures in the data? And what are the structures of these representative networks? We describe efficient nonparametric methods derived from the minimum description length principle to construct the network representations automatically. The methods input a population of networks or a multilayer network measured on a fixed set of nodes and output a small set of representative networks together with an assignment of each network sample or layer to one of the representative networks. We identify the representative networks and assign network samples to them with an efficient Monte Carlo scheme that minimizes our description length objective. For temporally ordered networks, we use a polynomial time dynamic programming approach that restricts the clusters of network layers to be temporally contiguous. These methods recover planted heterogeneity in synthetic network populations and identify essential structural heterogeneities in global trade and fossil record networks. Our methods are principled, scalable, parameter-free, and accommodate a wide range of data, providing a unified lens for exploratory analyses and preprocessing large sets of network samples.
Node similarity scores are a foundation for machine learning in graphs for clustering, node classification, anomaly detection, and link prediction with applications in biological systems, information networks, and recommender systems. Recent works on link prediction use vector space embeddings to calculate node similarities in undirected networks with good performance. Still, they have several disadvantages: limited interpretability, need for hyperparameter tuning, manual model fitting through dimensionality reduction, and poor performance from symmetric similarities in directed link prediction. We propose MapSim, an information-theoretic measure to assess node similarities based on modular compression of network flows. Unlike vector space embeddings, MapSim represents nodes in a discrete, non-metric space of communities and yields asymmetric similarities in an unsupervised fashion. We compare MapSim on a link prediction task to popular embedding-based algorithms across 47 networks and find that MapSim's average performance across all networks is more than 7% higher than its closest competitor, outperforming all embedding methods in 11 of the 47 networks. Our method demonstrates the potential of compression-based approaches in graph representation learning, with promising applications in other graph learning tasks.
Proceedings of Machine Learning Research, PMLR 198:52:1-52:18 (2022)
DOI ↗arXiv:2208.14220 PDF Google ScholarCode & data ↗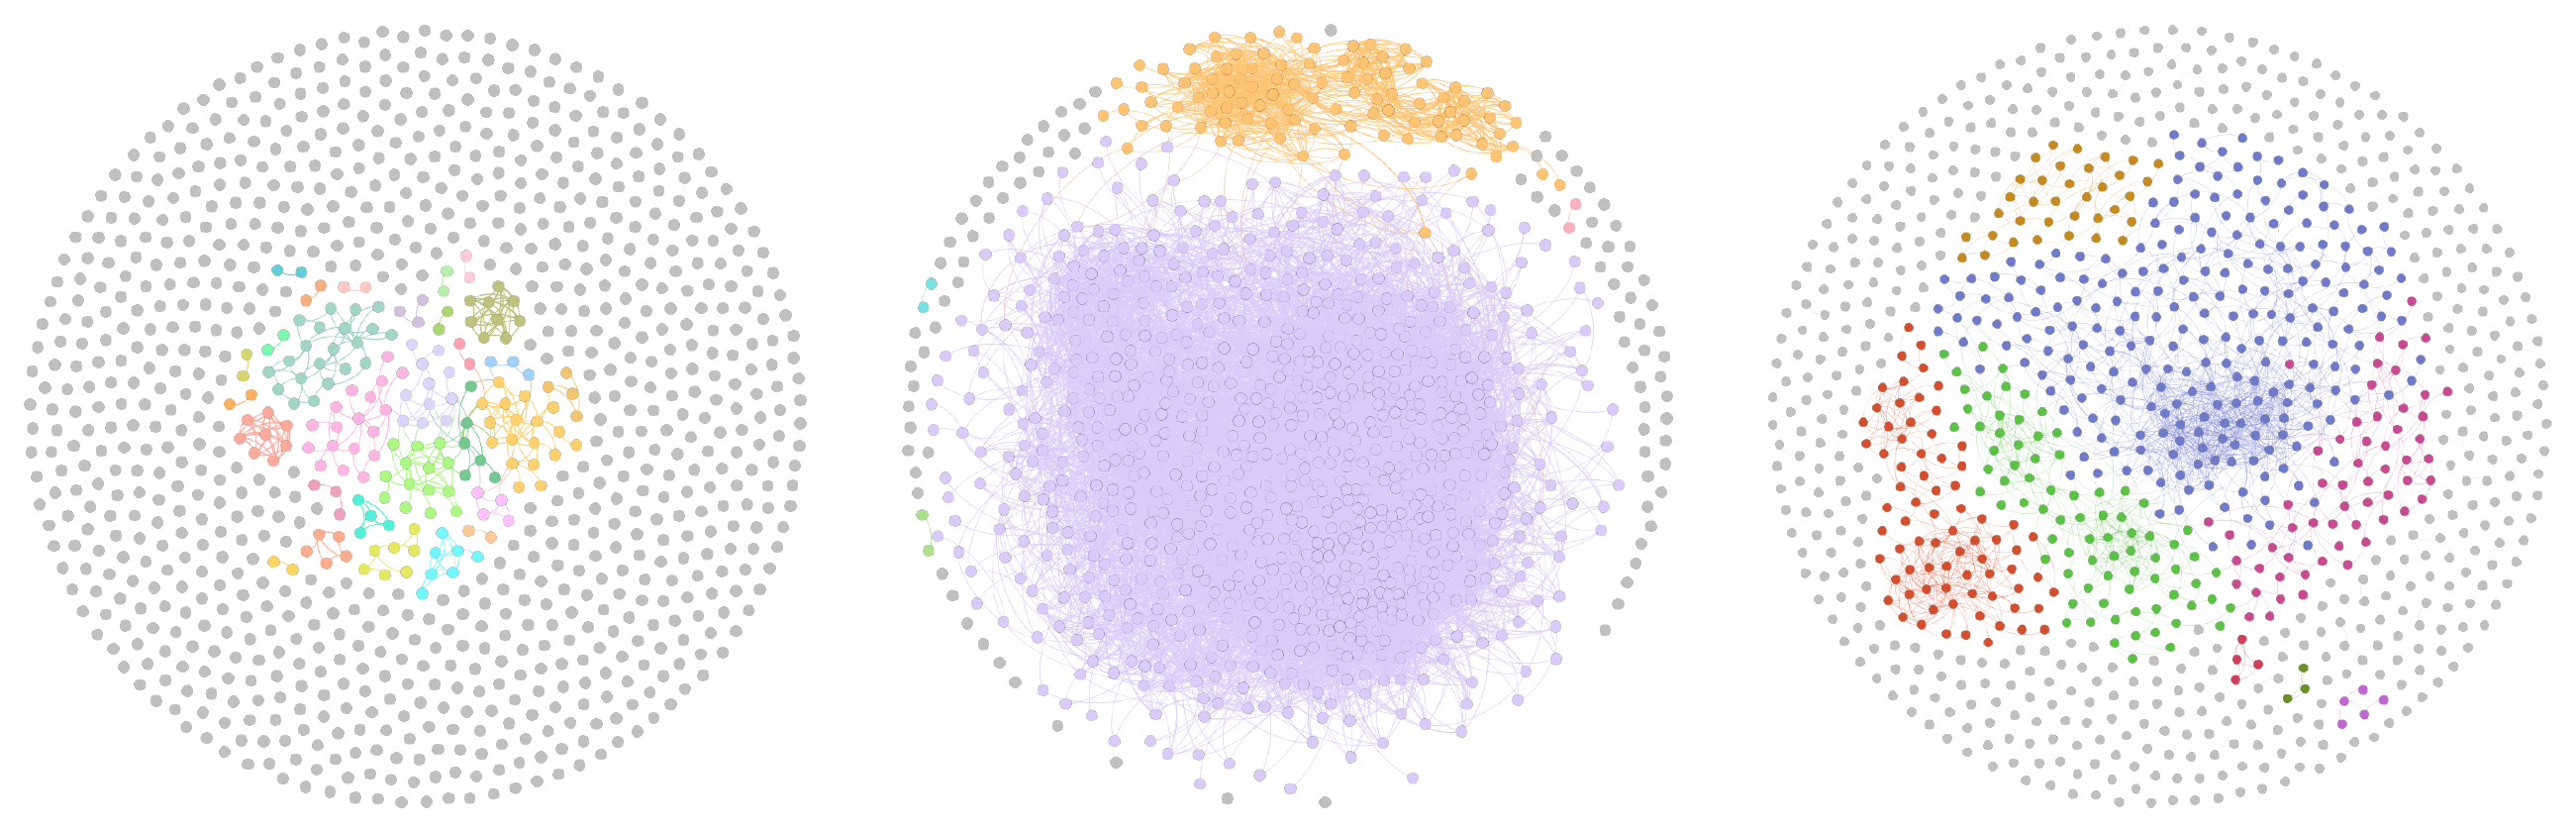
We propose a module-based cross-validation approach for thresholding correlation networks derived from multivariate data. By integrating modular structure into the sparsification process, the method addresses the challenge of balancing overfitting and underfitting. Tests on synthetic and real datasets show that its ability to recover a planted partition has a step-like dependence on the number of data samples, with diminishing gains beyond a critical threshold. Compared to the established WGCNA method, the approach reveals greater modular structure in the tested datasets.
From traffic flows on road networks to electrical signals in brain networks, many real-world networks contain modular structures of different sizes and densities. In the networks where modular structures emerge due to coupling between nodes with similar dynamical functions, we can identify them using flow-based community detection methods. However, these methods implicitly assume that communities are dense or clique-like which can shatter sparse communities due to a field-of-view limit inherent in one-step dynamics. Taking multiple steps with shorter or longer Markov time enables us to effectively zoom in or out to capture small or long-range communities. However, zooming out to avoid the field-of-view limit comes at the expense of introducing or increasing a lower resolution limit. Here we relax the constant Markov time constraint and introduce variable Markov dynamics as a multi-focal lens to capture functional communities in networks with a higher range of scales. With variable Markov time, a random walker can keep one-step dynamics in dense areas to avoid the resolution limit and move faster in sparse areas to detect long-range modular structures and prevent the field-of-view limit. We analyze the performance of variable Markov time using the flow-based community detection method called the map equation. We have implemented the map equation with variable Markov time in the search algorithm Infomap without any complexity overhead and tested its performance on synthetic and real-world networks from different domains. Results show that it outperforms the standard map equation in networks with constrained structures and locally sparse regions. In addition, the method estimates the optimal Markov time and avoids parameter tuning.
![Lazy encoding random walks on a schematic network with metadata. In this case, the random walk always encodes the next step if the target node's metadata is the same as the current node. When the metadata differs, the walker encodes with probability p in [1/3, 1] in a, p in [1/10, 1/3) in b, and p < 1/10 in c. Node shapes represent metadata, and node colors represent optimal partitions. Random walks with labeled circles where they encode and dashed lines where they do not, colored by the currently encoded module.](/publications/Bassolas-Etal-2021-MetadataInformed/lazy-random-walk.png)
Integrating structural information and metadata, such as gender, social status, or interests, enriches networks and enables a better understanding of the large-scale structure of complex systems. However, existing metadata integration approaches consider only immediately adjacent nodes, thus failing to identify and exploit non-local relations between metadata and network structure, typical of many spatial and social systems. We show how a flow-based community-detection approach can integrate network information and distant metadata, revealing more complex relations. We analyze social and spatial networks using the map equation framework and find that our methodology can detect functional metadata-informed communities in diverse real-world systems. For example, in a mobility network of London, we identify communities that reflect the income distribution, and in a European power-grid network, we identify communities that capture relations between geography and energy prices beyond country borders.
To measure node importance, network scientists employ centrality scores that typically take a microscopic or macroscopic perspective, relying on node features or global network structure. However, traditional centrality measures such as degree centrality, betweenness centrality, or PageRank neglect the community structure found in real-world networks. To study node importance based on network flows from a mesoscopic perspective, we analytically derive a community-aware information-theoretic centrality score based on network flow and the coding principles behind the map equation: map equation centrality. Map equation centrality measures how much further we can compress the network's modular description by not coding for random walker transitions to the respective node, using an adapted coding scheme and determining node importance from a network flow-based point of view. The information-theoretic centrality measure can be determined from a node's local network context alone because changes to the coding scheme only affect other nodes in the same module. Map equation centrality is agnostic to the chosen network flow model and allows researchers to select the model that best reflects the dynamics of the process under study. Applied to synthetic networks, we highlight how our approach enables a more fine-grained differentiation between nodes than node-local or network-global measures. Predicting influential nodes for two different dynamical processes on real-world networks with traditional and other community-aware centrality measures, we find that activating nodes based on map equation centrality scores tends to create the largest cascades in a linear threshold model.
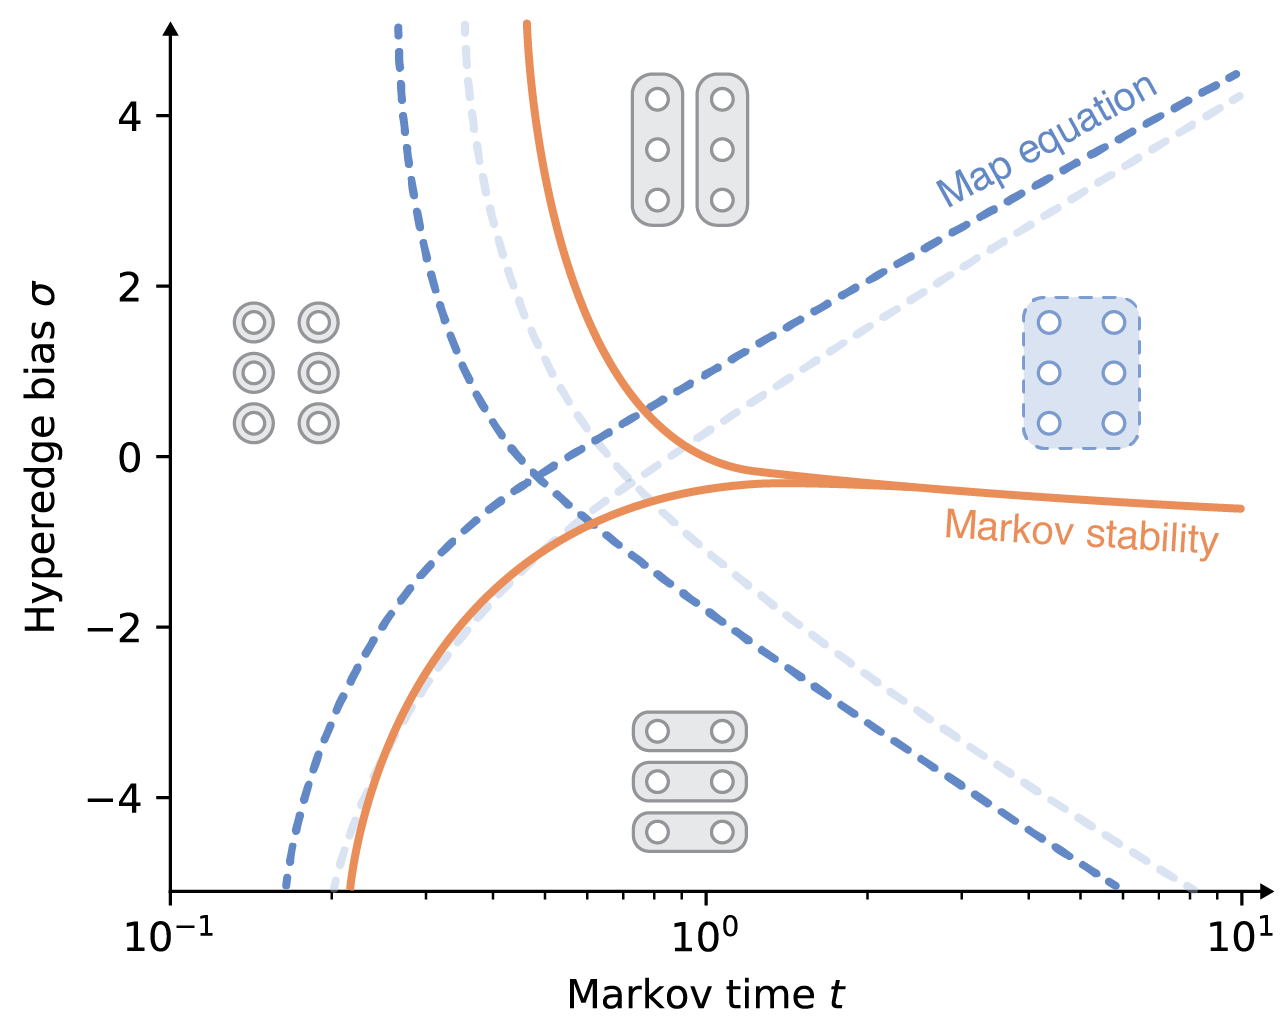
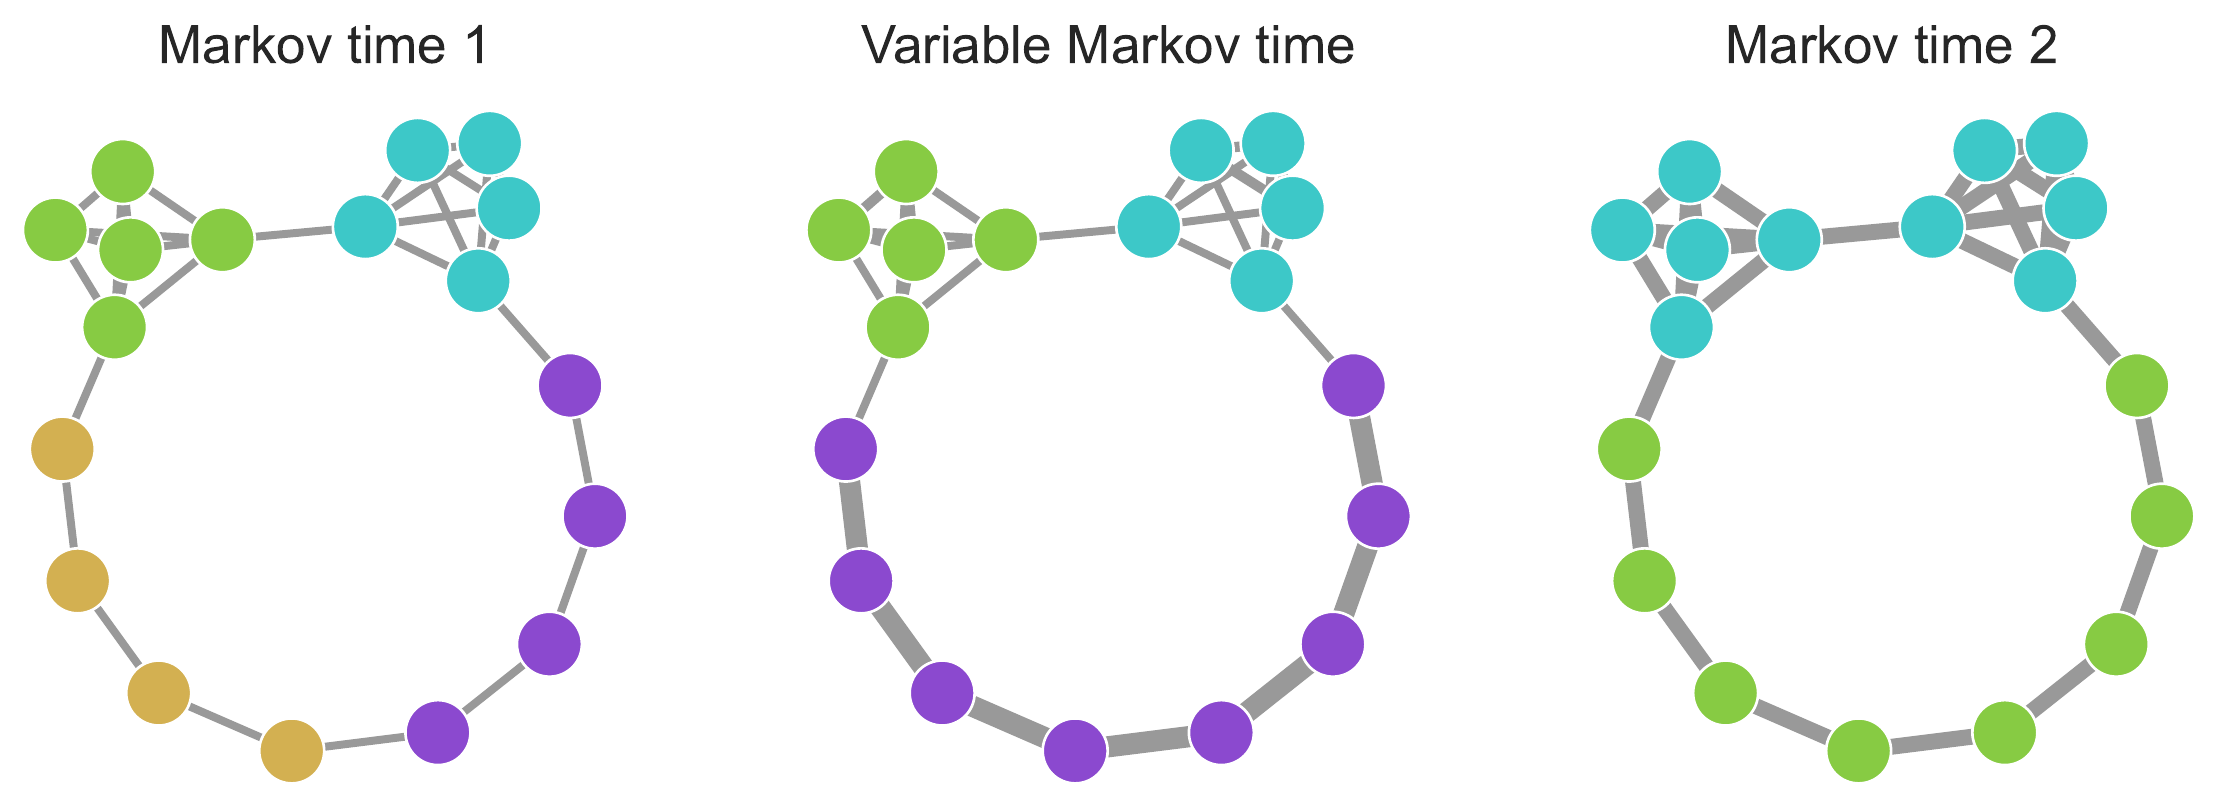
To connect structure, dynamics and function in systems with multibody interactions, network scientists model random walks on hypergraphs and identify communities that confine the walks for a long time. The two flow-based community-detection methods Markov stability and the map equation identify such communities based on different principles and search algorithms. But how similar are the resulting communities? We explain both methods' machinery applied to hypergraphs and compare them on synthetic and real-world hypergraphs using various hyperedge-size biased random walks and time scales. We find that the map equation is more sensitive to time-scale changes and that Markov stability is more sensitive to hyperedge-size biases.
Higher-Order Systems. Understanding Complex Systems. Springer, Cham.
DOI ↗arXiv:2105.04389 PDF Google Scholar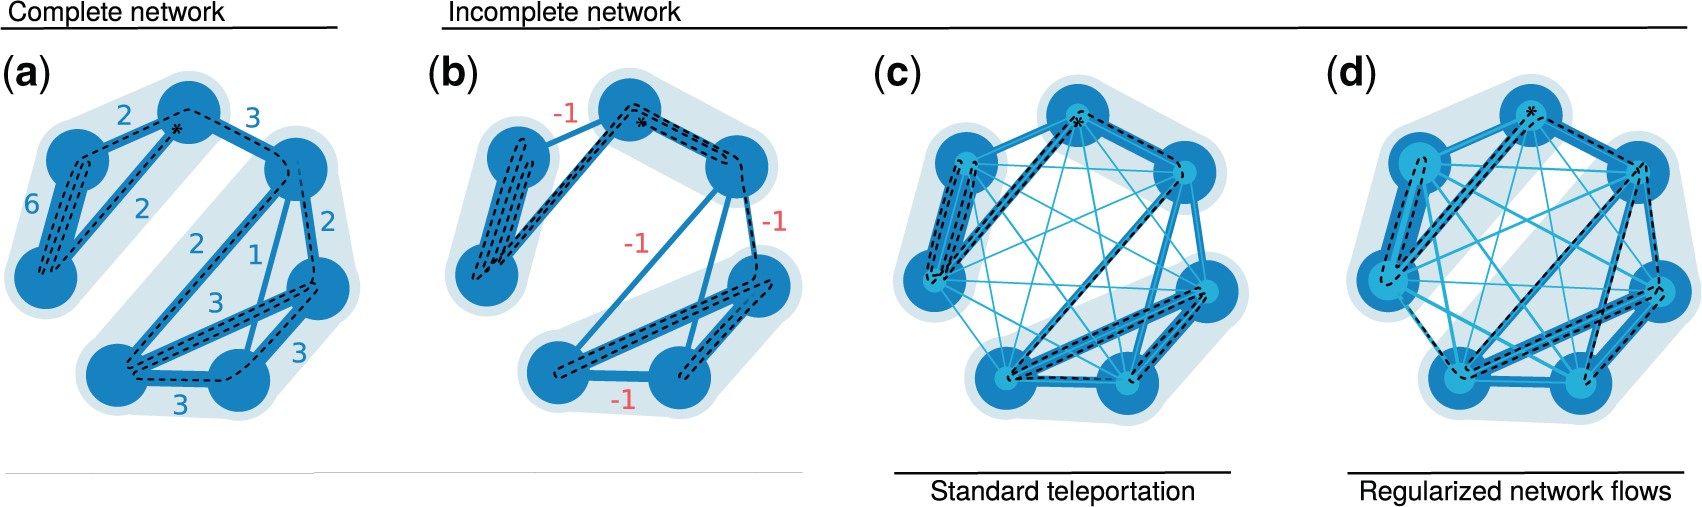
Detecting significant community structure in networks with incomplete observations is challenging because the evidence for specific solutions fades away with missing data. For example, recent research shows that flow-based community detection methods can highlight spurious communities in sparse undirected and unweighted networks with missing links. Current Bayesian approaches developed to overcome this problem do not work for incomplete observations in weighted and directed networks that describe network flows. To overcome this gap, we extend the idea behind the Bayesian estimate of the map equation for unweighted and undirected networks to enable more robust community detection in weighted and directed networks. We derive an empirical Bayes estimate of the transitions rates that can incorporate metadata information and show how an efficient implementation in the community-detection method Infomap provides more reliable communities even with a significant fraction of data missing.
Hypergraphs offer an explicit formalism to describe multibody interactions in complex systems. To connect dynamics and function in systems with these higher-order interactions, network scientists have generalised random-walk models to hypergraphs and studied the multibody effects on flow-based centrality measures. But mapping the large-scale structure of those flows requires effective community detection methods. We derive unipartite, bipartite, and multilayer network representations of hypergraph flows and explore how they and the underlying random-walk model change the number, size, depth, and overlap of identified multilevel communities. These results help researchers choose the appropriate modelling approach when mapping flows on hypergraphs.

Analysing how species interact in modules is a fundamental problem in network ecology. Theory shows that a modular network structure can reveal underlying dynamic ecological and evolutionary processes, influence dynamics that operate on the network and affect the stability of the ecological system. Although many ecological networks describe flows, such as biomass flows in food webs or disease transmission, most modularity analyses have ignored network flows, which can hinder our understanding of the interplay between structure and dynamics. Here we present Infomap, an established method based on network flows to the field of ecological networks. Infomap is a flexible tool that can identify modules in virtually any type of ecological network and is particularly useful for directed, weighted and multilayer networks. We illustrate how Infomap works on all these network types. We also provide a fully documented repository with additional ecological examples. Finally, to help researchers to analyse their networks with Infomap, we introduce the open-source R package infomapecology. Analysing flow-based modularity is useful across ecology and transcends to other biological and non-biological disciplines. A dynamic approach for detecting modu- lar structure has strong potential to provide new insights into the organisation of ecological networks.
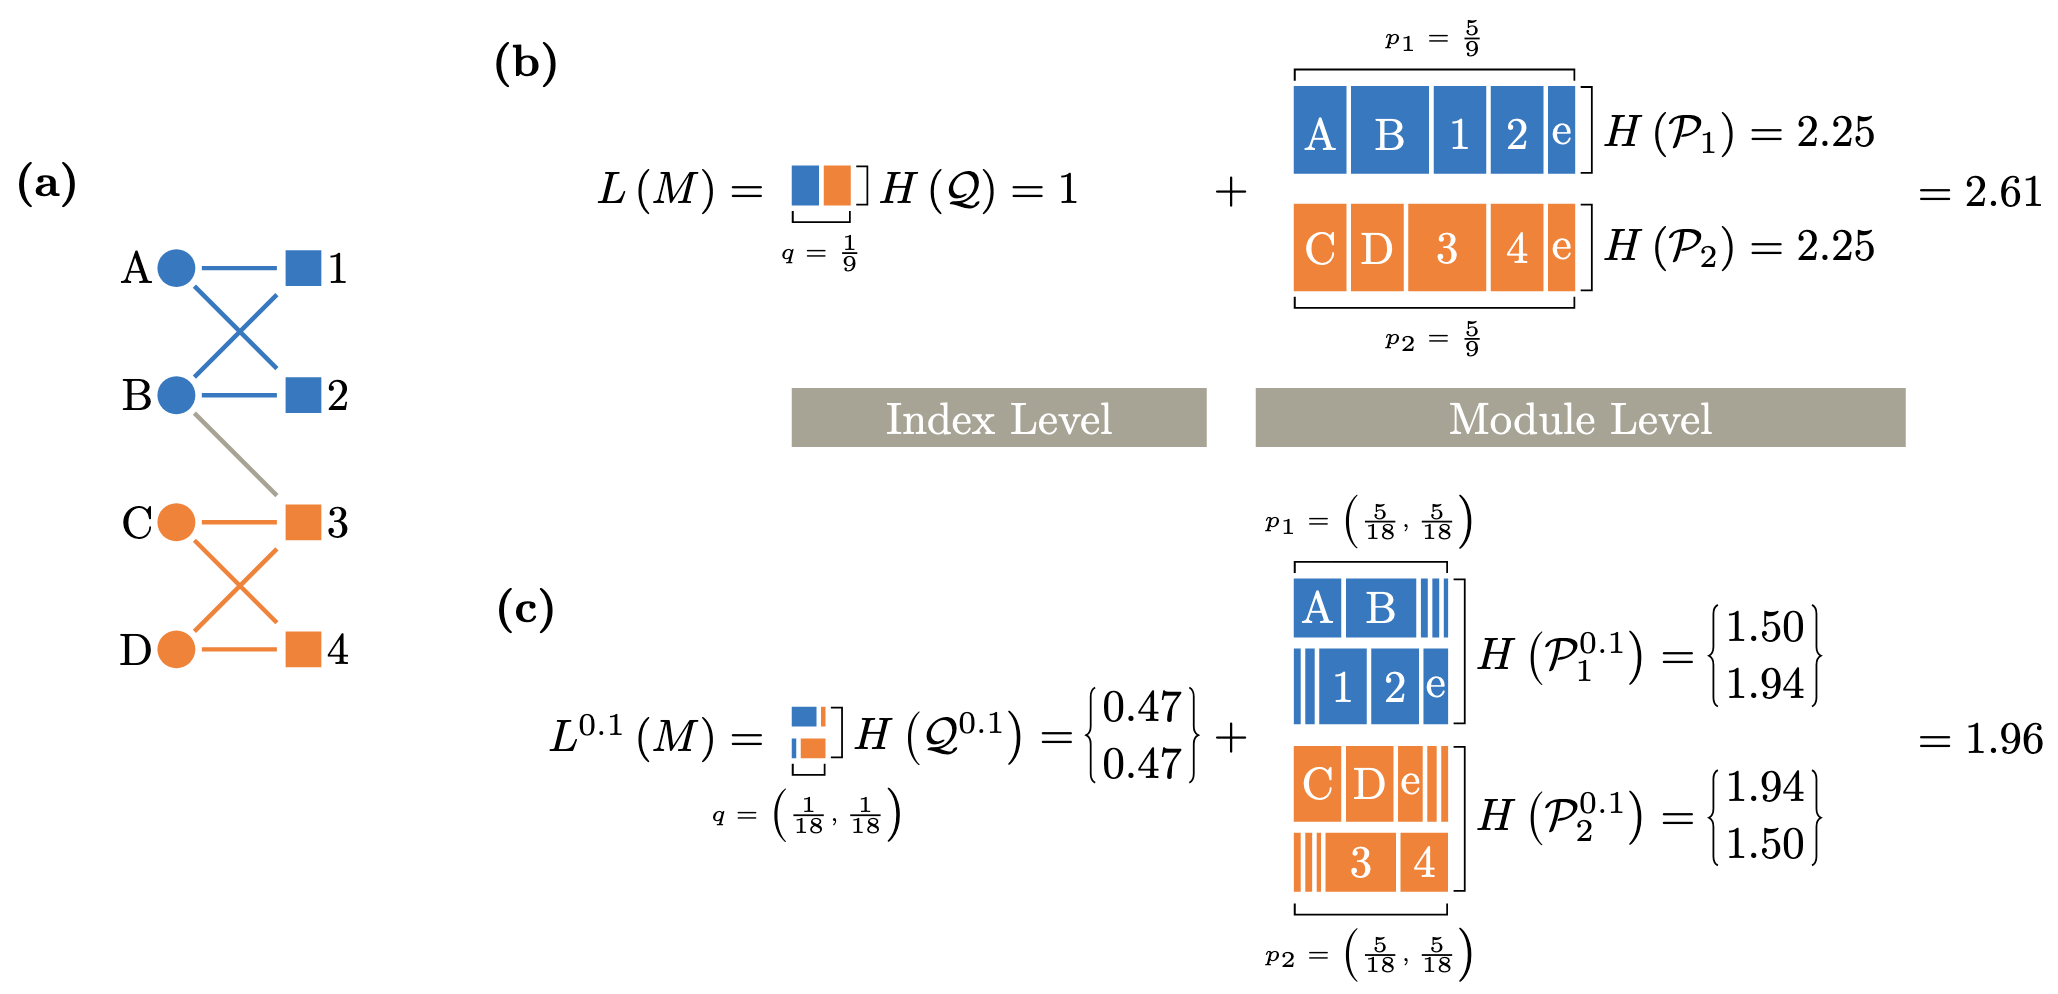
Mapping network flows provides insight into the organization of networks, but even though many real-networks are bipartite, no method for mapping flows takes advantage of the bipartite structure. What do we miss by discarding this information and how can we use it to understand the structure of bipartite networks better? The map equation models network flows with a random walk and exploits the information-theoretic duality between compression and finding regularities to detect communities in networks. However, it does not use the fact that random walks in bipartite networks alternate between node types, information worth 1 bit. To make some or all of this information available to the map equation, we developed a coding scheme that remembers node types at different rates. We explored the community landscape of bipartite real-world networks from no node-type information to full node-type information and found that using node types at a higher rate generally leads to deeper community hierarchies and a higher resolution. The corresponding compression of network flows exceeds the amount of extra information provided. Consequently, taking advantage of the bipartite structure increases the resolution and reveals more network regularities.
Unreliable network data can cause community-detection methods to overfit and highlight spurious structures with misleading information about the organization and function of complex systems. Here we show how to detect significant flow-based communities in sparse networks with missing links using the map equation. Since the map equation builds on Shannon entropy estimation, it assumes complete data such that analyzing undersampled networks can lead to overfitting. To overcome this problem, we incorporate a Bayesian approach with assumptions about network uncertainties into the map equation framework. Results in both synthetic and real-world networks show that the Bayesian estimate of the map equation provides a principled approach to revealing significant structures in undersampled networks.

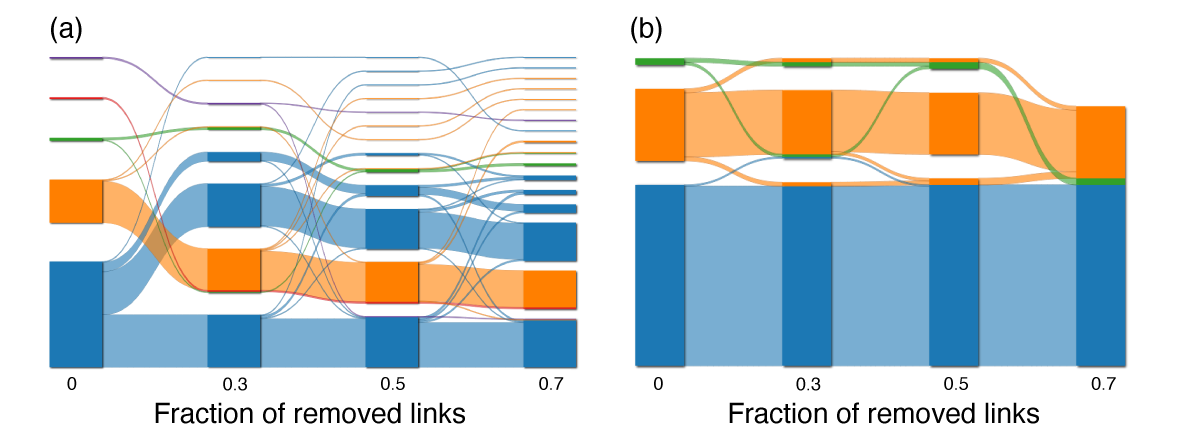
To understand how a complex system is organized and functions, researchers often identify communities in the system's network of interactions. Because it is practically impossible to explore all solutions to guarantee the best one, many community-detection algorithms rely on multiple stochastic searches. But for a given combination of network and stochastic algorithm, how many searches are sufficient to find a solution that is good enough? The standard approach is to pick a reasonably large number of searches and select the network partition with the highest quality or derive a consensus solution based on all network partitions. However, if different partitions have similar qualities such that the solution landscape is degenerate, the single best partition may miss relevant information, and a consensus solution may blur complementary communities. Here we address this degeneracy problem with coarse-grained descriptions of the solution landscape. We cluster network partitions based on their similarity and suggest an approach to determine the minimum number of searches required to describe the solution landscape adequately. To make good use of all partitions, we also propose different ways to explore the solution landscape, including a significance clustering procedure. We test these approaches on synthetic and real-world networks, and find that different networks and algorithms require a different number of searches and that exploring the coarse-grained solution landscape can reveal noteworthy complementary solutions and enable more reliable community detection.

Much of the community detection literature studies structural communities, communities defined solely by the connectivity patterns of the network. Often networks contain additional metadata which can inform community detection such as the grade and gender of students in a high school social network. In this work, we introduce a tuning parameter to the content map equation that allows users of the Infomap community detection algorithm to control the metadata’s relative importance for identifying network structure. On synthetic networks, we show that our algorithm can overcome the structural detectability limit when the metadata are well aligned with community structure. On real-world networks, we show how our algorithm can achieve greater mutual information with the metadata at a cost in the traditional map equation. Our tuning parameter, like the focusing knob of a microscope, allows users to “zoom in” and “zoom out” on communities with varying levels of focus on the metadata.

Many real-world networks are representations of dynamic systems with interactions that change over time, often in uncoordinated ways and at irregular intervals. For example, university students connect in intermittent groups that repeatedly form and dissolve based on multiple factors, including their lectures, interests, and friends. Such dynamic systems can be represented as multilayer networks where each layer represents a snapshot of the temporal network. In this representation, it is crucial that the links between layers accurately capture real dependencies between those layers. Often, however, these dependencies are unknown. Therefore, current methods connect layers based on simplistic assumptions that cannot capture node-level layer dependencies. For example, connecting every node to itself in other layers with the same weight can wipe out essential dependencies between intermittent groups, making it difficult or even impossible to identify them. In this paper, we present a principled approach to estimating node-level layer dependencies based on the network structure within each layer. We implement our node-level coupling method in the community detection framework Infomap and demonstrate its performance compared to current methods on synthetic and real temporal networks. We show that our approach more effectively constrains information inside multilayer communities so that Infomap can better recover planted groups in multilayer benchmark networks that represent multiple modes with different groups and better identify intermittent communities in real temporal contact networks. These results suggest that node-level layer coupling can improve the modeling of information spreading in temporal networks and better capture their dynamic community structure.
Biogeographical regions (bioregions) reveal how different sets of species are spatially grouped and therefore are important units for conservation, historical biogeography, ecol- ogy and evolution. Several methods have been developed to identify bioregions based on species distribution data rather than expert opinion. One approach successfully applies network theory to simplify and highlight the underlying structure in species distributions. However, this method lacks tools for simple and efficient analysis. Here we present In- fomap Bioregions, an interactive web application that inputs species distribution data and generates bioregion maps. Species distributions may be provided as georeferenced point occurrences or range maps, and can be of local, regional or global scale. The application uses a novel adaptive resolution method to make best use of often incomplete species dis- tribution data. The results can be downloaded as vector graphics, shapefiles or in table format. We validate the tool by processing large datasets of publicly available species distribution data of the world’s amphibians using species ranges, and mammals using point occurrences. As examples of applications, researchers can reconstruct ancestral ranges in historical biogeography or identify indicator species for targeted conservation.

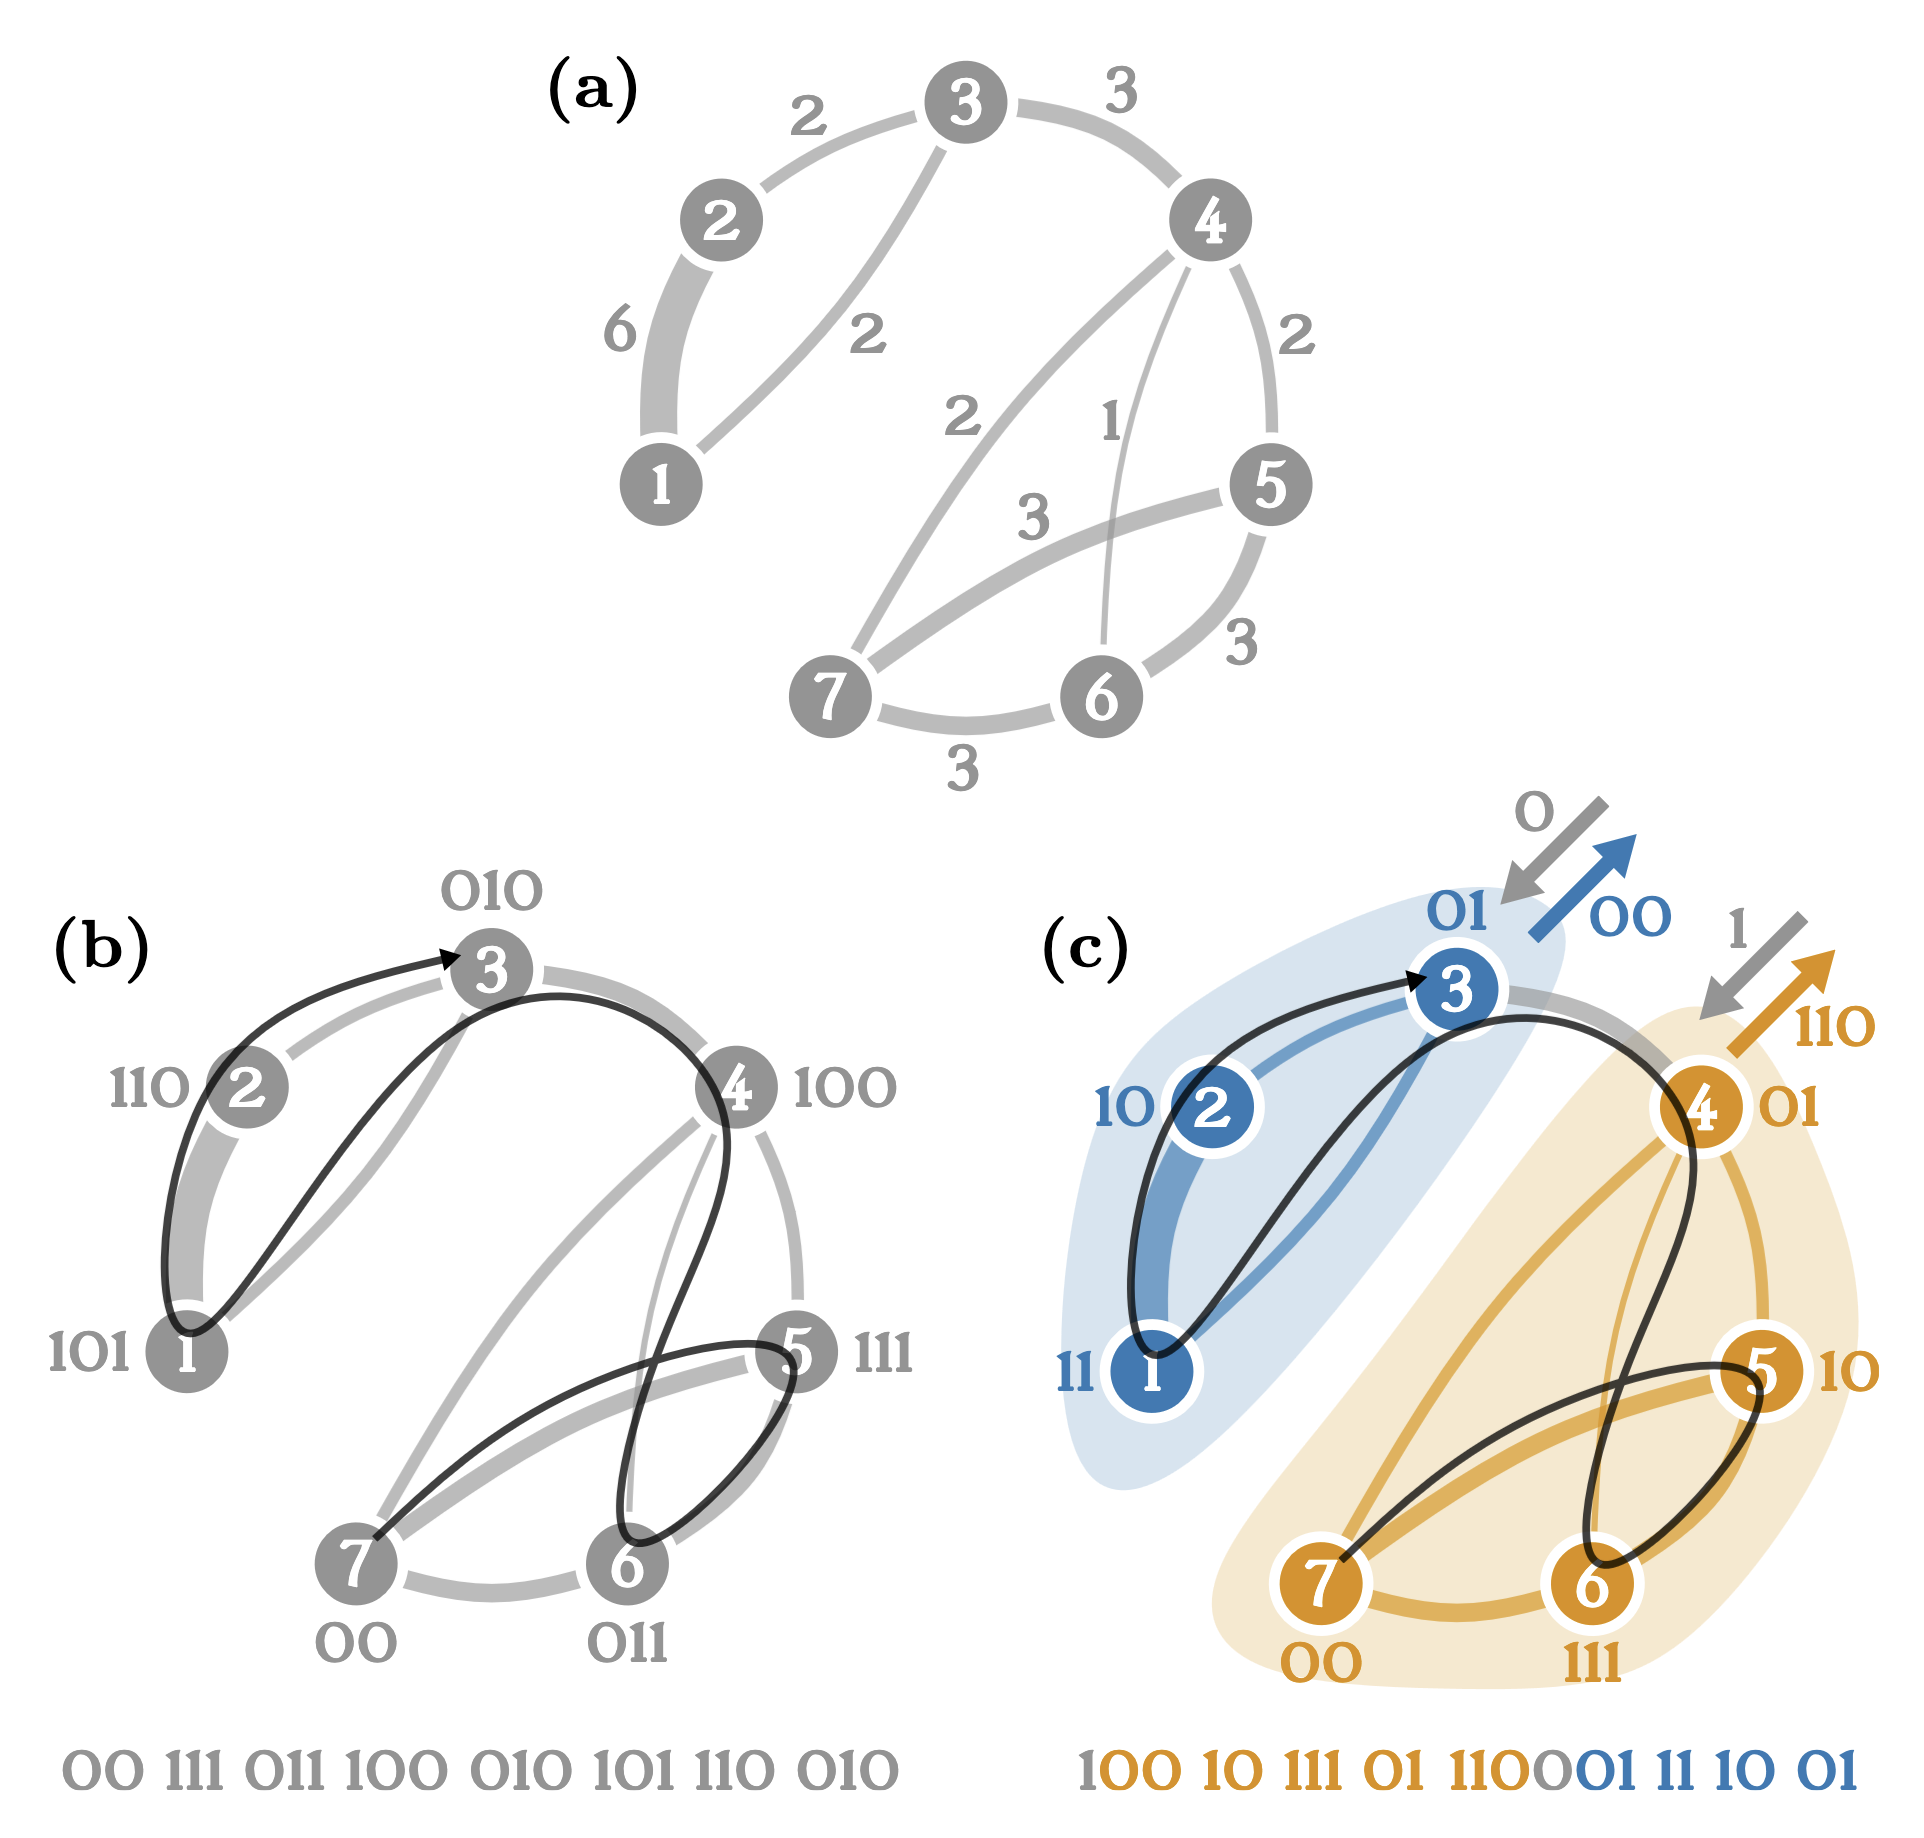
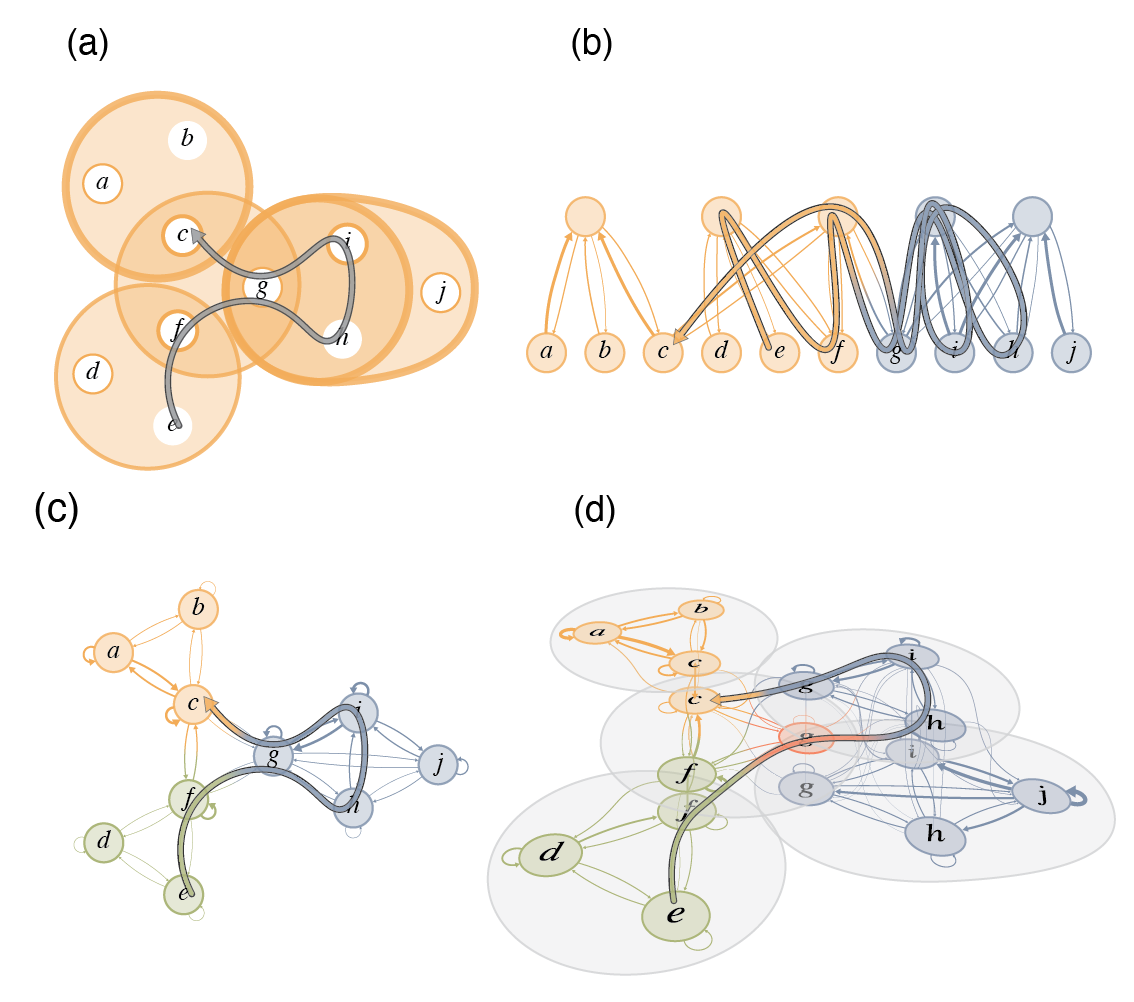
Comprehending complex systems by simplifying and highlighting important dynamical patterns requires modeling and mapping higher-order network flows. However, complex systems come in many forms and demand a range of representations, including memory and multilayer networks, which in turn call for versatile community-detection algorithms to reveal important modular regularities in the flows. Here we show that various forms of higher-order network flows can be represented in a unified way with networks that distinguish physical nodes for representing a complex system’s objects from state nodes for describing flows between the objects. Moreover, these so-called sparse memory networks allow the information-theoretic community detection method known as the map equation to identify overlapping and nested flow modules in data from a range of different higher-order interactions such as multistep, multi-source, and temporal data. We derive the map equation applied to sparse memory networks and describe its search algorithm Infomap, which can exploit the flexibility of sparse memory networks. Together they provide a general solution to reveal overlapping modular patterns in higher-order flows through complex systems.
In evolving complex systems such as air traffic and social organisations, collective effects emerge from their many components' dynamic interactions. While the dynamic interactions can be represented by temporal networks with nodes and links that change over time, they remain highly complex. It is therefore often necessary to use methods that extract the temporal networks' large-scale dynamic community structure. However, such methods are subject to overfitting or suffer from effects of arbitrary, a priori-imposed timescales, which should instead be extracted from data. Here we simultaneously address both problems and develop a principled data-driven method that determines relevant timescales and identifies patterns of dynamics that take place on networks, as well as shape the networks themselves. We base our method on an arbitrary-order Markov chain model with community structure, and develop a nonparametric Bayesian inference framework that identifies the simplest such model that can explain temporal interaction data.

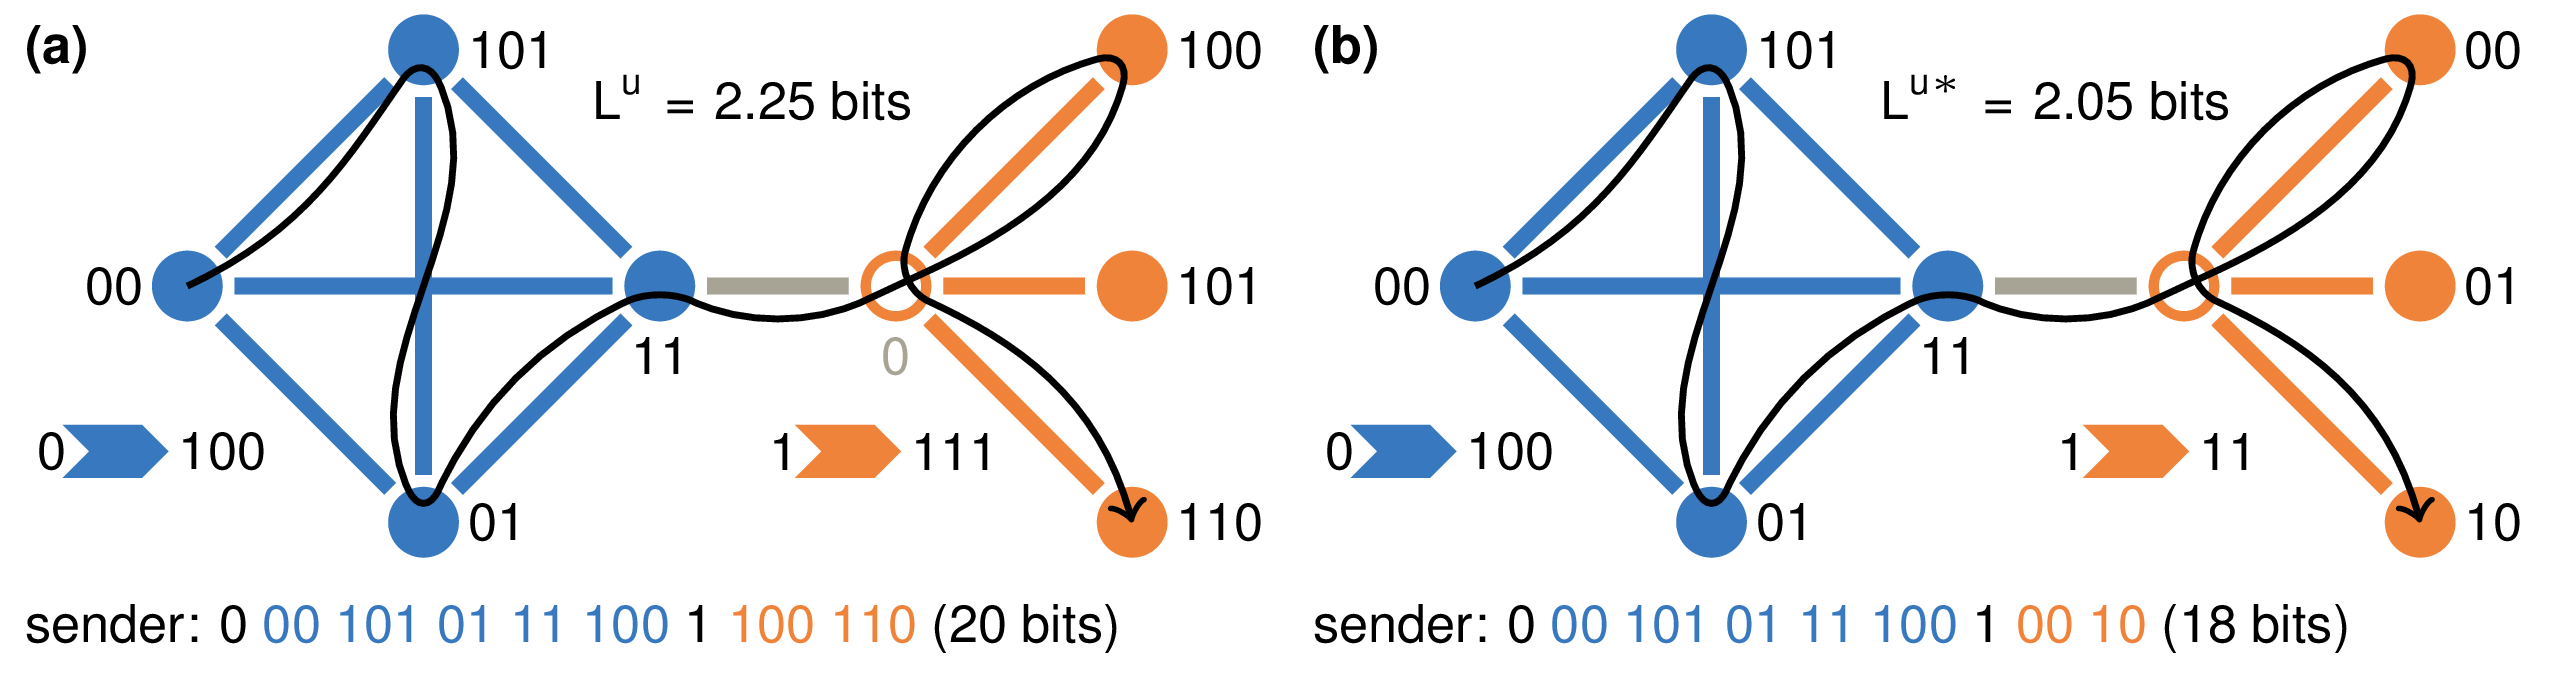
Community detection of network flows conventionally assumes one-step dynamics on the links. For sparse networks and interest in large-scale structures, longer timescales may be more appropriate. Oppositely, for large networks and interest in small-scale structures, shorter timescales may be better. However, current methods for analyzing networks at different timescales require expensive and often infeasible network reconstructions. To overcome this problem, we introduce a method that takes advantage of the inner-workings of the map equation and evades the reconstruction step. This makes it possible to efficiently analyze large networks at different Markov times with no extra overhead cost. The method also evades the costly unipartite projection for identifying flow modules in bipartite networks.

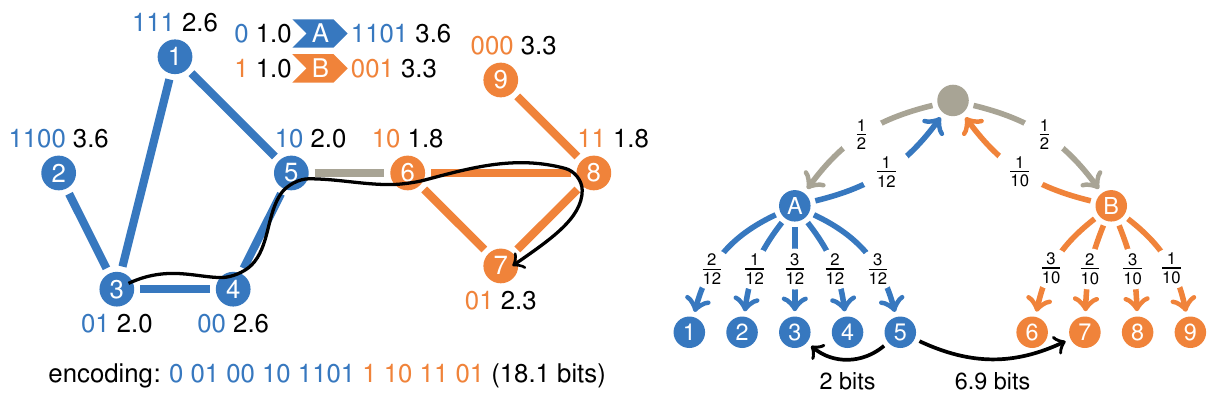
To better understand the flows of ideas or information through social and biological systems, researchers develop maps that reveal important patterns in network flows. In practice, network flow models have implied memoryless first-order Markov chains, but recently researchers have introduced higher-order Markov chain models with memory to capture patterns in multi-step pathways. Higher-order models are particularly important for effectively revealing actual, overlapping community structure, but higher-order Markov chain models suffer from the curse of dimensionality: their vast parameter spaces require exponentially increasing data to avoid overfitting and therefore make mapping inefficient already for moderate-sized systems. To overcome this problem, we introduce an efficient cross-validated mapping approach based on network flows modeled by sparse Markov chains. To illustrate our approach, we present a map of citation flows in science with research fields that overlap in multidisciplinary journals. Compared with currently used categories in science of science studies, the research fields form better units of analysis because the map more effectively captures how ideas flow through science.

To comprehend interconnected systems across the social and natural sciences, researchers have developed many powerful methods to identify functional modules. For example, with interaction data aggregated into a single network layer, flow-based methods have proven useful for identifying modular dynamics in weighted and directed networks that capture constraints on flow processes. However, many interconnected systems consist of agents or components that exhibit multiple layers of interactions, possibly from several different processes. Inevitably, representing this intricate network of networks as a single aggregated network leads to information loss and may obscure the actual organization. Here, we propose a method based on a compression of network flows that can identify modular flows both within and across layers in nonaggregated multilayer networks. Our numerical experiments on synthetic multilayer networks, with some layers originating from the same interaction process, show that the analysis fails in aggregated networks or when treating the layers separately, whereas the multilayer method can accurately identify modules across layers that originate from the same interaction process. We capitalize on our findings and reveal the community structure of two multilayer collaboration networks with topics as layers: scientists affiliated with the Pierre Auger Observatory and scientists publishing works on networks on the arXiv. Compared to conventional aggregated methods, the multilayer method uncovers connected topics and reveals smaller modules with more overlap that better capture the actual organization.

A community detection algorithm is considered to have a resolution limit if the scale of the smallest modules that can be resolved depends on the size of the analyzed subnetwork. The resolution limit is known to prevent some community detection algorithms from accurately identifying the modular structure of a network. In fact, any global objective function for measuring the quality of a two-level assignment of nodes into modules must have some sort of resolution limit or an external resolution parameter. However, it is yet unknown how the resolution limit affects the so-called map equation, which is known to be an efficient objective function for community detection. We derive an analytical estimate and conclude that the resolution limit of the map equation is set by the total number of links between modules instead of the total number of links in the full network as for modularity. This mechanism makes the resolution limit much less restrictive for the map equation than for modularity; in practice, it is orders of magnitudes smaller. Furthermore, we argue that the effect of the resolution limit often results from shoehorning multilevel modular structures into two-level descriptions. As we show, the hierarchical map equation effectively eliminates the resolution limit for networks with nested multilevel modular structures.
Large networks contain plentiful information about the organization of a system. The challenge is to extract useful information buried in the structure of myriad nodes and links. Therefore, powerful tools for simplifying and highlighting important structures in networks are essential for comprehending their organization. Such tools are called community-detection methods and they are designed to identify strongly intraconnected modules that often correspond to important functional units. Here we describe one such method, known as the map equation, and its accompanying algorithms for finding, evaluating, and visualizing the modular organization of networks. The map equation framework is very flexible and can identify two-level, multi-level, and overlapping organization in weighted, directed, and multiplex networks with its search algorithm Infomap. Because the map equation framework operates on the flow induced by the links of a network, it naturally captures flow of ideas and citation flow, and is therefore well-suited for analysis of bibliometric networks.

Random walks on networks is the standard tool for modelling spreading processes in social and biological systems. This first-order Markov approach is used in conventional community detection, ranking and spreading analysis, although it ignores a potentially important feature of the dynamics: where flow moves to may depend on where it comes from. Here we analyse pathways from different systems, and although we only observe marginal consequences for disease spreading, we show that ignoring the effects of second-order Markov dynamics has important consequences for community detection, ranking and information spreading. For example, capturing dynamics with a second-order Markov model allows us to reveal actual travel patterns in air traffic and to uncover multidisciplinary journals in scientific communication. These findings were achieved only by using more available data and making no additional assumptions, and therefore suggest that accounting for higher-order memory in network flows can help us better understand how real systems are organized and function.

Random teleportation is a necessary evil for ranking and clustering directed networks based on random walks. Teleportation enables ergodic solutions, but the solutions must necessarily depend on the exact implementation and parametrization of the teleportation. For example, in the commonly used PageRank algorithm, the teleportation rate must trade off a heavily biased solution with a uniform solution. Here we show that teleportation to links rather than nodes enables a much smoother trade-off and effectively more robust results. We also show that, by not recording the teleportation steps of the random walker, we can further reduce the effect of teleportation with dramatic effects on clustering.

To better understand the organization of overlapping modules in large networks with respect to flow, we introduce the map equation for overlapping modules. In this information-theoretic framework, we use the correspondence between compression and regularity detection. The generalized map equation measures how well we can compress a description of flow in the network when we partition it into modules with possible overlaps. When we minimize the generalized map equation over overlapping network partitions, we detect modules that capture flow and determine which nodes at the boundaries between modules should be classified in multiple modules and to what degree. With a novel greedy-search algorithm, we find that some networks, for example, the neural network of the nematode Caenorhabditis elegans, are best described by modules dominated by hard boundaries, but that others, for example, the sparse European-roads network, have an organization of highly overlapping modules.

To comprehend the hierarchical organization of large integrated systems, we introduce the hierarchical map equation that reveals multilevel structures in networks. In this information-theoretic approach, we exploit the duality between compression and pattern detection; by compressing a description of a random walker as a proxy for real flow on a network, we find regularities in the network that induce this system-wide flow. Finding the shortest multilevel description of the random walker therefore gives us the best hierarchical clustering of the network — the optimal number of levels and modular partition at each level — with respect to the dynamics on the network. With a novel search algorithm, we extract and illustrate the rich multilevel organization of several large social and biological networks. For example, from the global air traffic network we uncover countries and continents, and from the pattern of scientific communication we reveal more than 100 scientific fields organized in four major disciplines: life sciences, physical sciences, ecology and earth sciences, and social sciences. In general, we find shallow hierarchical structures in globally interconnected systems, such as neural networks, and rich multilevel organizations in systems with highly separated regions, such as road networks.

Change is the very nature of interaction patterns in biology, technology, economics, and science itself: The interactions within and between organisms change; the air, ground, and sea traffic change; the global financial flow changes; the scientific research front changes. With increasingly available data, networks and clustering tools have become important methods used to comprehend instances of these large-scale structures. But blind to the difference between noise and trends in the data, these tools alone must fail when used to study change. Only if we can assign significance to the partition of single networks can we distinguish structural changes from fluctuations and assess how much confidence we should have in the changes. Here we show that bootstrap resampling accompanied by significance clustering provides a solution to this problem. We use the significance clustering to realize de Solla Price's vision of mapping the change in science.

Many real-world networks are so large that we must simplify their structure before we can extract useful information about the systems they represent. As the tools for doing these simplifications proliferate within the network literature, researchers would benefit from some guidelines about which of the so-called community detection algorithms are most appropriate for the structures they are studying and the questions they are asking. Here we show that different methods highlight different aspects of a network's structure and that the the sort of information that we seek to extract about the system must guide us in our decision. For example, many community detection algorithms, including the popular modularity maximization approach, infer module assignments from an underlying model of the network formation process. However, we are not always as interested in how a system's network structure was formed, as we are in how a network's extant structure influences the system's behavior. To see how structure influences current behavior, we will recognize that links in a network induce movement across the network and result in system-wide interdependence. In doing so, we explicitly acknowledge that most networks carry flow. To highlight and simplify the network structure with respect to this flow, we use the map equation. We present an intuitive derivation of this flow-based and information-theoretic method and provide an interactive on-line application that anyone can use to explore the mechanics of the map equation. The differences between the map equation and the modularity maximization approach are not merely conceptual. Because the map equation attends to patterns of flow on the network and the modularity maximization approach does not, the two methods can yield dramatically different results for some network structures. To illustrate this and build our understanding of each method, we partition several sample networks. We also describe an algorithm and provide source code to efficiently decompose large weighted and directed networks based on the map equation.

To comprehend the multipartite organization of large-scale biological and social systems, we introduce a new information-theoretic approach to reveal community structure in weighted and directed networks. The method decomposes a network into modules by optimally compressing a description of information flows on the network. The result is a map that both simplifies and highlights the regularities in the structure and their relationships to each other. We illustrate the method by making a map of scientific communication as captured in the citation patterns of more than 6000 journals. We discover a multicentric organization with fields that vary dramatically in size and degree of integration into the network of science. Along the backbone of the network — which includes physics, chemistry, molecular biology, and medicine — information flows bidirectionally, but the map reveals a directional pattern of citation from the applied fields to the basic sciences.